Norco: Fire Incidents, California (CA)
Where are fire incidents reported in Norco, CA
Something went wrong! Please refresh the page.
|
| |||||||||||||||||||||||||||||||||||||||||||||||||||||||||||||||||||||||||||||||||||||||||||||||||||||||||||||
2005 - 2018 National Fire Incident Reporting System (NFIRS) incidents
- Incident types reported to NFIRS in Norco, CA
- 31646.8%Fire
- 22633.5%Hazardous Condition
- 679.9%Service Call
- 314.6%Rescue & EMS
- 314.6%Good Intent Call
- 40.6%False Alarm
- Fire incident types reported to NFIRS in Norco, CA
- 11436.1%Outside Fires
- 10432.9%Structure Fires
- 8526.9%Mobile Property/Vehicle Fires
- 134.1%Other
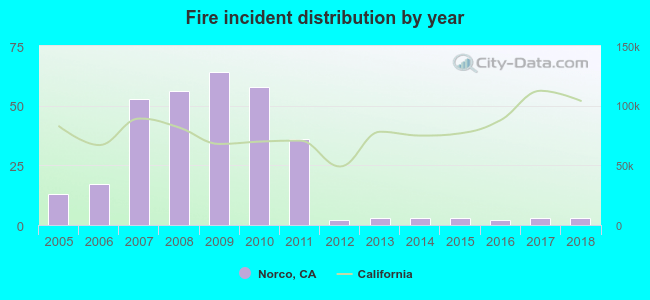 Based on the data from the years 2005 - 2018 the average number of fires per year is 23. The highest number of fires - 64 took place in 2009, and the least - 2 in 2012. The data has a dropping trend.
The average number of yearly fire incidents per 10k residents in Norco, CA compared to nearest cities:
(Note: Based on data for the last 3 years, including only cities with population 5,000 and above)
| Norco: | 1.0 |
| Eastvale: | 0.2 |
| Corona: | 7.0 |
| Home Gardens: | 0.9 |
| Jurupa: | 0.1 |
| Rubidoux: | 1.3 |
| Ontario: | 9.3 |
| Riverside: | 29.1 |
| Chino: | 11.2 |

 According to the data from the years 2005 - 2018 the average number of fire-related yearly casualties is 1. The highest number of reported casualties - 3 took place in 2007, and the lowest - 0 in 2005. The data has a constant trend.
 37.0% incidents where reported in the morning and 63.0% in the evening. The most fires (17.4%) took place on Monday, and the least (11.7%) on Wednesday.
 Based on the 316 fires from years 2005 - 2018 most fires (13.6%) took place during July, and the least (2.8%) in October.
 Out of all 675 cases reported during the years 2005 - 2018, the most belonged to the categories: Fire (46.8%), Rescue & EMS (33.5%), and Hazardous Condition (9.9%).
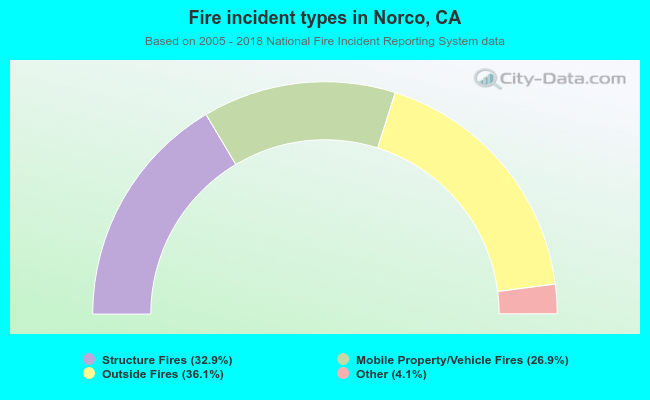 When looking into fire subcategories, the most reports belonged to: Outside Fires (36.1%), and Structure Fires (32.9%).