Northglenn: Fire Incidents, Colorado (CO)
Where are fire incidents reported in Northglenn, CO
Something went wrong! Please refresh the page.
| Fire incidents reported | |
|---|---|
| Sreet name | Count |
| MELODY DR | 308 |
| WASHINGTON ST | 192 |
| COMMUNITY CENTER DR | 152 |
| HURON ST | 116 |
| MALLEY DR | 112 |
| 120TH AVE | 104 |
| 104TH AVE | 102 |
| IRMA DR | 82 |
| CLAUDE CT | 80 |
| PECOS ST | 78 |
| 112TH AVE | 56 |
| GRANT DR | 54 |
| PEARL ST | 50 |
| I25 HWY | 44 |
| 105TH PL | 34 |
| GARLAND DR | 32 |
| KIMBLEWYCK CIR | 32 |
| I25 SB HWY | 30 |
| 114TH AVE | 28 |
| 116TH AVE | 28 |
| CLARKSON ST | 28 |
| NIVER AVE | 28 |
| 100TH PL | 26 |
| PHILLIPS DR | 26 |
| SHERMAN ST | 24 |
| LARRY DR | 22 |
| LEROY DR | 22 |
| NORTHGLENN DR | 22 |
| 99TH AVE | 20 |
| RACE ST | 20 |
2003 - 2018 National Fire Incident Reporting System (NFIRS) incidents
- Incident types reported to NFIRS in Northglenn, CO
- 16,11865.1%Rescue & EMS
- 2,2749.2%Good Intent Call
- 2,0698.4%Service Call
- 1,6026.5%Fire
- 1,5006.1%Hazardous Condition
- 1,1604.7%False Alarm
- Fire incident types reported to NFIRS in Northglenn, CO
- 84953.0%Structure Fires
- 48430.2%Outside Fires
- 22414.0%Mobile Property/Vehicle Fires
- 452.8%Other
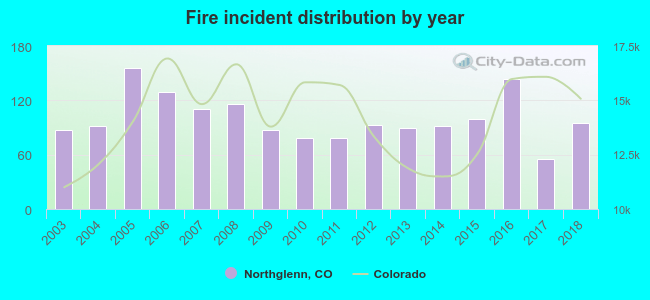 Based on the data from the years 2003 - 2018 the average number of fires per year is 100. The highest number of fire incidents - 156 took place in 2005, and the least - 55 in 2017. The data has an increasing trend.
The average number of yearly fire incidents per 10k residents in Northglenn, CO compared to nearest cities:
(Note: Based on data for the last 3 years, including only cities with population 5,000 and above)
| Northglenn: | 25.4 |
| Thornton: | 21.3 |
| Federal Heights: | 36.4 |
| Welby: | 0.7 |
| Westminster: | 19.6 |
| Broomfield: | 16.5 |
| Commerce City: | 24.8 |
| Arvada: | 14.3 |
| Lafayette: | 23.8 |
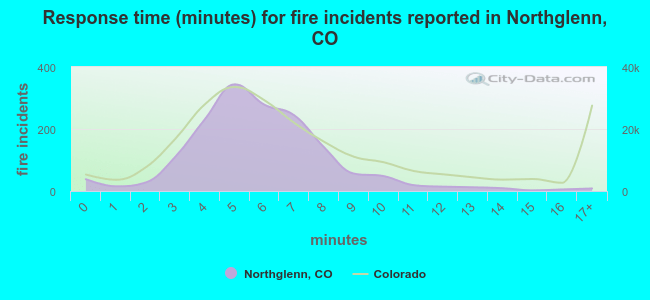 The median response time based on all reported fire incidents is 6 minutes. This is comparable to the Colorado median value.
The median response time in Northglenn, CO compared to nearest cities:
(Note: Based on data for all years, including only cities with at least 500 fire incidents)
| Northglenn: | 6 minutes |
| Thornton: | 7 minutes |
| Federal Heights: | 5 minutes |
| Westminster: | 5 minutes |
| Broomfield: | 6 minutes |
| Commerce City: | 5 minutes |
| Arvada: | 5 minutes |
| Lafayette: | 5 minutes |
| Brighton: | 6 minutes |
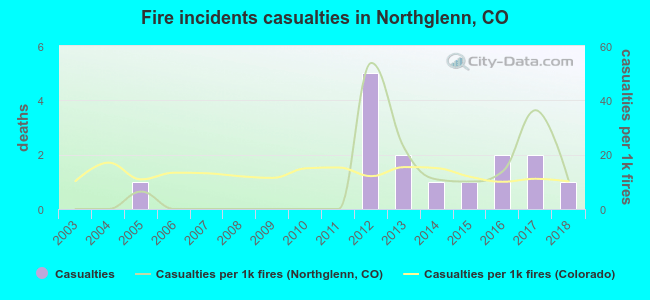 Based on the data from the years 2003 - 2018 the average number of fire-related casualties per year is 1. The highest number of injuries - 5 took place in 2012, and the lowest - 0 in 2003. The data has a growing trend.
The average number of injuries per 1,000 fire incidents is 10. This indicator was the highest - 54 in 2012, and the lowest 0 in 2003. The trend for injuries per 1,000 fires is growing. Compared to the Colorado value the number of casualties per 1,000 fires is lower.
Based on the data from the years 2003 - 2018 the average number of fire-related casualties per year is 1. The highest number of injuries - 5 took place in 2012, and the lowest - 0 in 2003. The data has a growing trend.
The average number of injuries per 1,000 fire incidents is 10. This indicator was the highest - 54 in 2012, and the lowest 0 in 2003. The trend for injuries per 1,000 fires is growing. Compared to the Colorado value the number of casualties per 1,000 fires is lower.Casualties per 1,000 incidents in Northglenn, CO compared to nearest cities:
(Note: Based on data for all years, including only cities with at least 500 fire incidents)
| Northglenn: | 9.4 |
| Thornton: | 13.9 |
| Federal Heights: | 21.2 |
| Westminster: | 34.0 |
| Broomfield: | 11.7 |
| Commerce City: | 12.1 |
| Arvada: | 13.9 |
| Lafayette: | 5.1 |
| Brighton: | 4.2 |
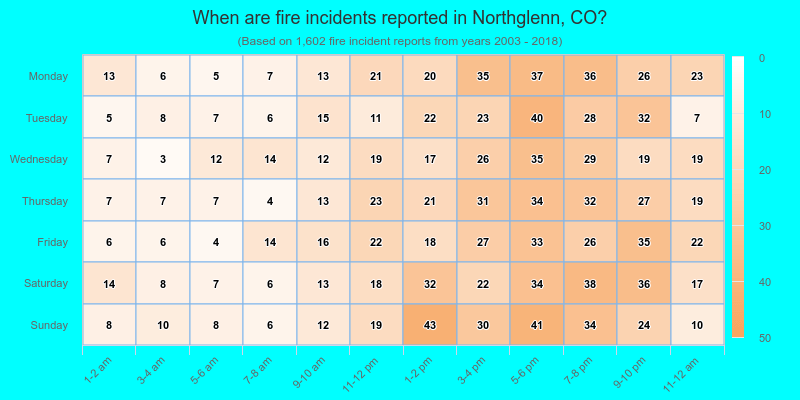
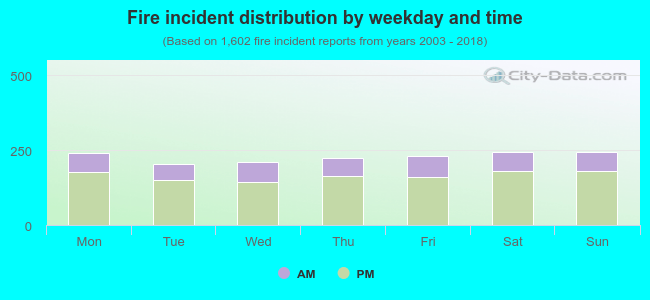 27.6% incidents where reported in the morning and 72.4% in the evening. The most fires (15.3%) took place on Saturday, and the least (12.7%) on Tuesday.
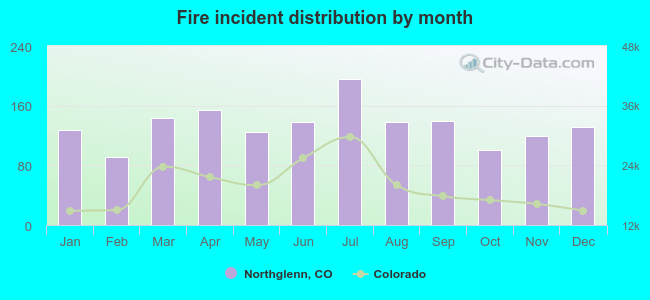 Based on the 1,602 fire incident reports from years 2003 - 2018 most fires (12.2%) took place during July, and the least (5.7%) in February.
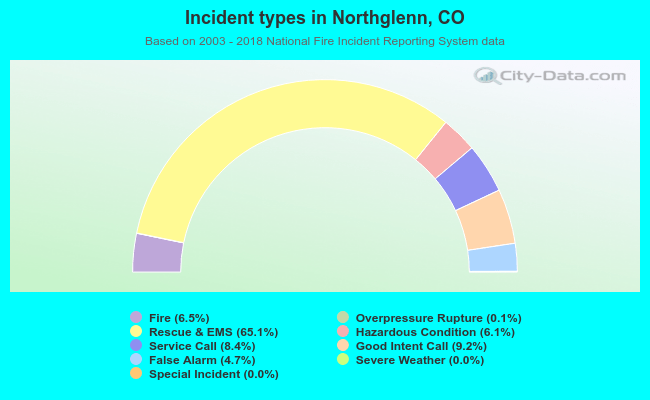 Out of all 24,758 cases reported during the years 2003 - 2018, the most belonged to the categories: Rescue & EMS (65.1%), Good Intent Call (9.2%), and Service Call (8.4%).
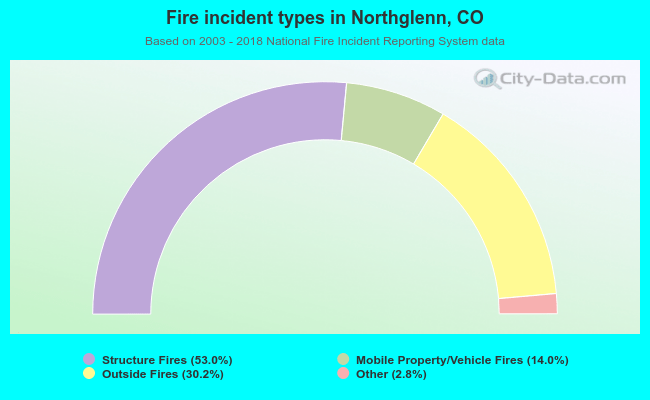 When looking into fire subcategories, the most incidents belonged to: Structure Fires (53.0%), and Outside Fires (30.2%).