Oakhurst: Fire Incidents, New Jersey (NJ)
Where are fire incidents reported in Oakhurst, NJ
Something went wrong! Please refresh the page.
|
| |||||||||||||||||||||||||||||||||||||||||||||||||||||||||||||||||||||||||||||||||||||||||||||||||||||||||||||
2002 - 2016 National Fire Incident Reporting System (NFIRS) incidents
- Incident types reported to NFIRS in Oakhurst, NJ
- 1,07247.3%Hazardous Condition
- 69130.5%Fire
- 31513.9%False Alarm
- 833.7%Good Intent Call
- 693.0%Service Call
- 341.5%Rescue & EMS
- Fire incident types reported to NFIRS in Oakhurst, NJ
- 47068.0%Structure Fires
- 17525.3%Outside Fires
- 436.2%Mobile Property/Vehicle Fires
- 30.4%Other
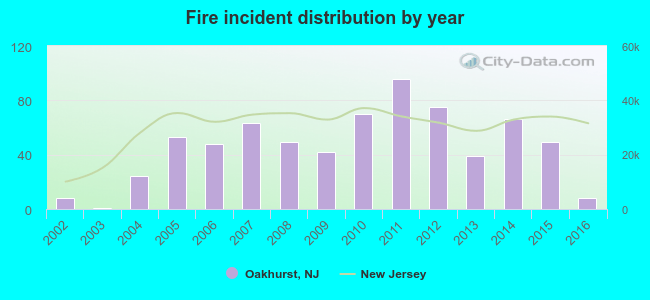 Based on the data from the years 2002 - 2016 the average number of fires per year is 46. The highest number of reported fire incidents - 96 took place in 2011, and the least - 1 in 2003. The data has a constant trend.
 The median response time based on all reported fire incidents is 5 minutes. This is close to the state median value.
The median response time in Oakhurst, NJ compared to nearest cities:
(Note: Based on data for all years, including only cities with at least 500 fire incidents)
| Oakhurst: | 5 minutes |
| West Long Branch: | 4 minutes |
| Eatontown: | 5 minutes |
| Asbury Park: | 3 minutes |
| Long Branch: | 3 minutes |
| Tinton Falls: | 7 minutes |
| Manasquan: | 5 minutes |
| Freehold: | 5 minutes |
| Morganville: | 4 minutes |
 27.2% incidents where reported in the morning and 72.8% in the evening. The most fires (16.8%) took place on Thursday, and the least (10.4%) on Saturday.
 Based on the 691 fires from years 2002 - 2016 most fires (9.7%) took place during June, and the least (7.1%) in September.
 Out of all 2,264 cases reported during the years 2002 - 2016, the most belonged to the categories: Rescue & EMS (47.3%), Fire (30.5%), and Good Intent Call (13.9%).
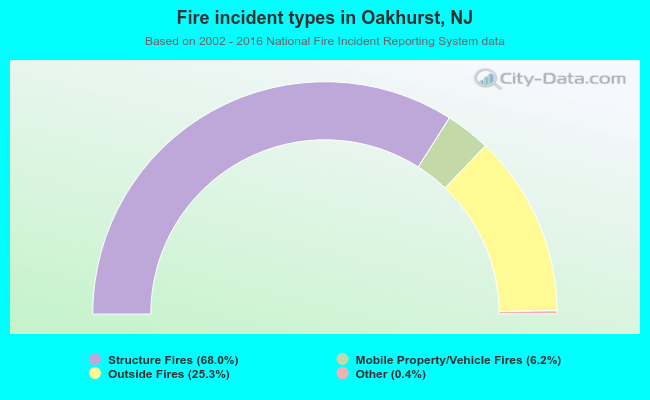 When looking into fire subcategories, the most reports belonged to: Structure Fires (68.0%), and Outside Fires (25.3%).