Oelwein: Fire Incidents, Iowa (IA)
Where are fire incidents reported in Oelwein, IA
Something went wrong! Please refresh the page.
|
| |||||||||||||||||||||||||||||||||||||||||||||||||||||||||||||||||||||||||||||||||||||||||||||||||||||||||||||
2002 - 2017 National Fire Incident Reporting System (NFIRS) incidents
- Incident types reported to NFIRS in Oelwein, IA
- 81835.7%Hazardous Condition
- 46420.3%Fire
- 46420.3%Service Call
- 28312.4%Rescue & EMS
- 1235.4%Good Intent Call
- 843.7%False Alarm
- 321.4%Severe Weather
- 170.7%Special Incident
- 60.3%Overpressure Rupture
- Fire incident types reported to NFIRS in Oelwein, IA
- 21746.8%Structure Fires
- 19341.6%Outside Fires
- 4810.3%Mobile Property/Vehicle Fires
- 61.3%Other
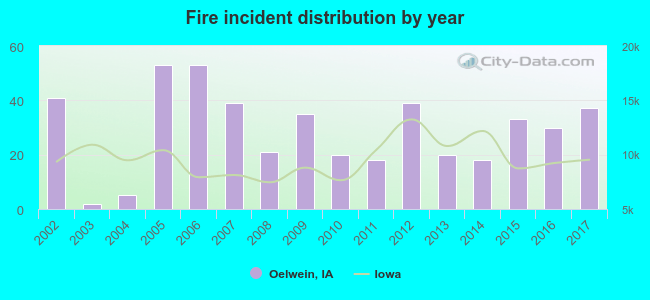 Based on the data from the years 2002 - 2017 the average number of fire incidents per year is 29. The highest number of fire incidents - 53 took place in 2005, and the least - 2 in 2003. The data has a decreasing trend.
The average number of yearly fire incidents per 10k residents in Oelwein, IA compared to nearest cities:
(Note: Based on data for the last 3 years, including only cities with population 5,000 and above)
| Oelwein: | 54.2 |
| Independence: | 18.9 |
| Waterloo: | 30.0 |
| Manchester: | 28.2 |
| Waverly: | 4.0 |
| Cedar Falls: | 6.9 |
| Vinton: | 29.1 |

 According to the reports from the years 2002 - 2017 the average number of fire-related casualties per year is 1. The highest number of casualties - 6 took place in 2012, and the lowest - 0 in 2002. The data has an increasing trend.
 32.5% incidents where reported in the morning and 67.5% in the evening. The most fires (16.2%) took place on Monday, and the least (11.4%) on Thursday.
 Based on the 464 reports from years 2002 - 2017 most fires (11.6%) took place during April, and the least (4.1%) in February.
 Out of all 2,291 cases reported during the years 2002 - 2017, the most belonged to the categories: Hazardous Condition (35.7%), Fire (20.3%), and Service Call (20.3%).
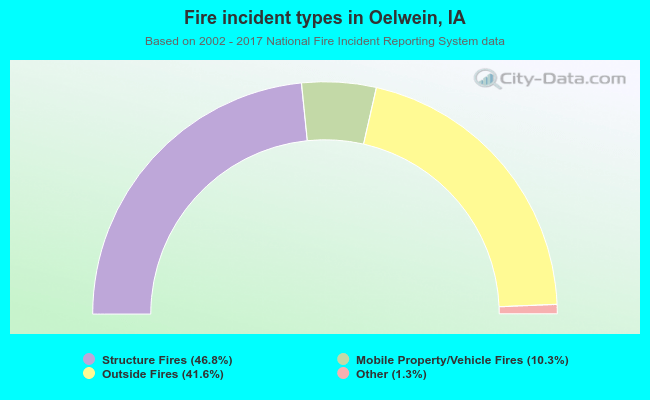 When looking into fire subcategories, the most reports belonged to: Structure Fires (46.8%), and Outside Fires (41.6%).