Ogden: Fire Incidents, Utah (UT)
Where are fire incidents reported in Ogden, UT
Something went wrong! Please refresh the page.
| Fire incidents reported | |
|---|---|
| Sreet name | Count |
| WASHINGTON BLVD | 364 |
| HARRISON BLVD | 288 |
| WALL AVE | 238 |
| MONROE BLVD | 212 |
| ADAMS AVE | 184 |
| JEFFERSON AVE | 184 |
| 24TH ST | 164 |
| GRANT AVE | 156 |
| 25TH ST | 132 |
| 12TH ST | 122 |
| CANYON RD | 120 |
| LINCOLN AVE | 116 |
| 27TH ST | 112 |
| CHILDS AVE | 102 |
| 26TH ST | 98 |
| GRAMERCY AVE | 94 |
| 28TH ST | 92 |
| MADISON AVE | 92 |
| 21ST ST | 88 |
| QUINCY AVE | 86 |
| PARK BLVD | 82 |
| JACKSON AVE | 78 |
| 20TH ST | 76 |
| 22ND ST | 76 |
| 30TH ST | 76 |
| 23RD ST | 74 |
| 7TH ST | 74 |
| 31ST ST | 72 |
| VAN BUREN AVE | 70 |
| 29TH ST | 68 |
| Other | 344 |
2002 - 2018 National Fire Incident Reporting System (NFIRS) incidents
- Incident types reported to NFIRS in Ogden, UT
- 28,92758.9%Rescue & EMS
- 8,09416.5%Good Intent Call
- 4,1348.4%Fire
- 3,6617.5%Hazardous Condition
- 2,2494.6%Service Call
- 1,8803.8%False Alarm
- 860.2%Special Incident
- Fire incident types reported to NFIRS in Ogden, UT
- 1,73742.0%Outside Fires
- 1,73141.9%Structure Fires
- 51512.5%Mobile Property/Vehicle Fires
- 1513.7%Other
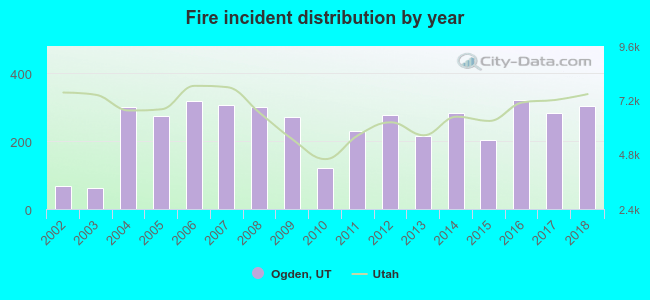 According to the data from the years 2002 - 2018 the average number of fires per year is 243. The highest number of fire incidents - 320 took place in 2016, and the least - 61 in 2003. The data has a rising trend.
The average number of yearly fire incidents per 10k residents in Ogden, UT compared to nearest cities:
(Note: Based on data for the last 3 years, including only cities with population 5,000 and above)
| Ogden: | 35.9 |
| South Ogden: | 21.4 |
| Washington Terrace: | 1.1 |
| Riverdale: | 33.0 |
| Harrisville: | 15.4 |
| West Haven: | 40.6 |
| Farr West: | 34.2 |
| North Ogden: | 12.1 |
| Roy: | 20.1 |
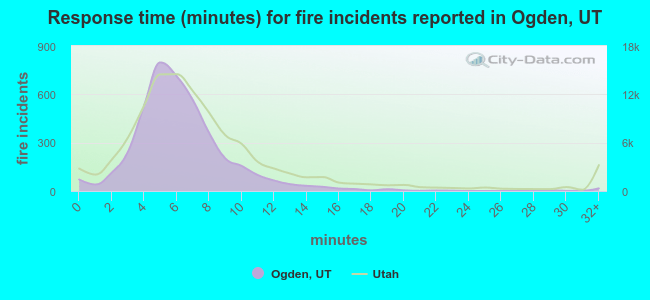 The median response time based on all reported fire incidents is 6 minutes. This is close to the state median value.
The median response time in Ogden, UT compared to nearest cities:
(Note: Based on data for all years, including only cities with at least 500 fire incidents)
| Ogden: | 6 minutes |
| Riverdale: | 6 minutes |
| West Haven: | 7 minutes |
| Roy: | 6 minutes |
| Clearfield: | 6 minutes |
| Layton: | 6 minutes |
| Syracuse: | 6 minutes |
| Kaysville: | 6 minutes |
| Farmington: | 7 minutes |
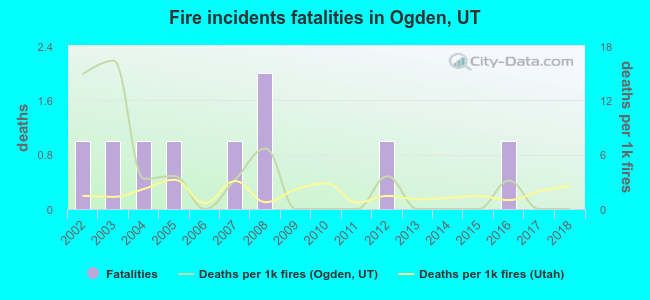 According to the reports from the years 2002 - 2018 the average number of fire-related yearly deaths is 1. The highest number of reported deaths - 2 took place in 2008, and the lowest - 0 in 2006. The data has a declining trend.
The average number of deaths per 1,000 fire incidents is 3. This indicator was the highest - 16 in 2003, and the lowest 0 in 2006. The trend for fatalities per 1,000 fire incidents is dropping. Compared to the Utah value the number of fatalities per 1,000 fires is higher.
According to the reports from the years 2002 - 2018 the average number of fire-related yearly deaths is 1. The highest number of reported deaths - 2 took place in 2008, and the lowest - 0 in 2006. The data has a declining trend.
The average number of deaths per 1,000 fire incidents is 3. This indicator was the highest - 16 in 2003, and the lowest 0 in 2006. The trend for fatalities per 1,000 fire incidents is dropping. Compared to the Utah value the number of fatalities per 1,000 fires is higher.Deaths per 1,000 incidents in Ogden, UT compared to nearest cities:
(Note: Based on data for all years, including only cities with at least 2,500 fire incidents)
| Ogden: | 2.2 |
| Salt Lake City: | 1.8 |
| West Valley City: | 2.1 |
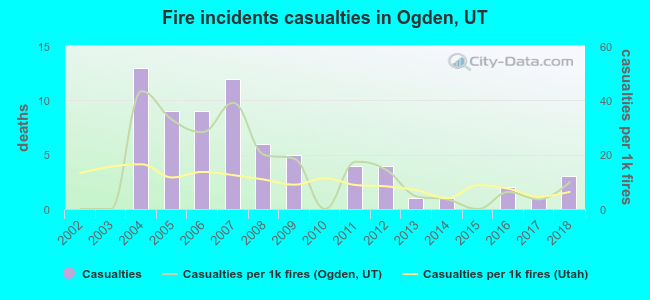 According to the reports from the years 2002 - 2018 the average number of fire-related yearly casualties is 4. The highest number of injuries - 13 took place in 2004, and the lowest - 0 in 2002. The data has an increasing trend.
The average number of injuries per 1,000 fires is 14. This indicator was the highest - 43 in 2004, and the lowest 0 in 2002. The trend for injuries per 1,000 incidents is rising. Compared to the state value the number of casualties per 1,000 incidents is higher.
According to the reports from the years 2002 - 2018 the average number of fire-related yearly casualties is 4. The highest number of injuries - 13 took place in 2004, and the lowest - 0 in 2002. The data has an increasing trend.
The average number of injuries per 1,000 fires is 14. This indicator was the highest - 43 in 2004, and the lowest 0 in 2002. The trend for injuries per 1,000 incidents is rising. Compared to the state value the number of casualties per 1,000 incidents is higher.Casualties per 1,000 incidents in Ogden, UT compared to nearest cities:
(Note: Based on data for all years, including only cities with at least 500 fire incidents)
| Ogden: | 16.9 |
| Riverdale: | 0.0 |
| West Haven: | 6.0 |
| Roy: | 7.4 |
| Clearfield: | 23.0 |
| Layton: | 30.2 |
| Syracuse: | 1.5 |
| Kaysville: | 21.2 |
| Farmington: | 1.7 |
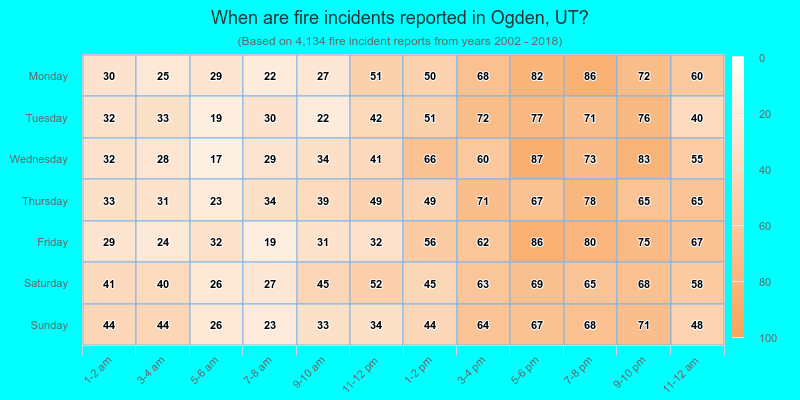
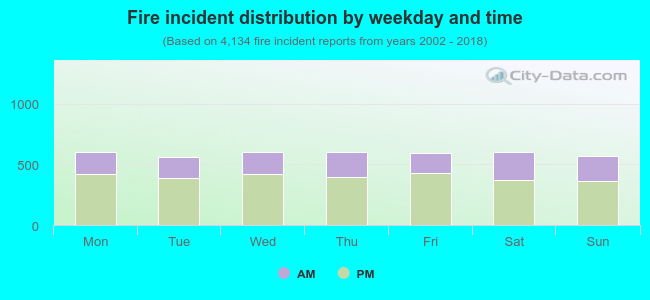 32.8% incidents where reported in the morning and 67.2% in the evening. The most fires (14.6%) took place on Wednesday, and the least (13.7%) on Tuesday.
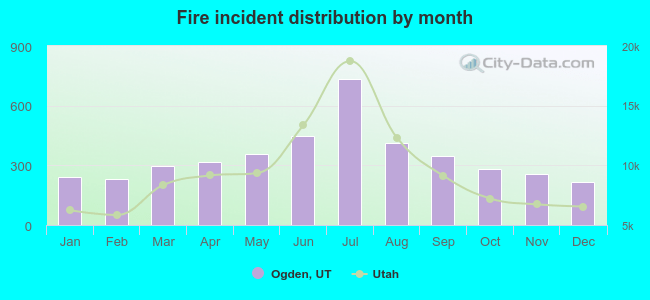 Based on the 4,134 fires from years 2002 - 2018 most fires (17.8%) took place during July, and the least (5.2%) in December.
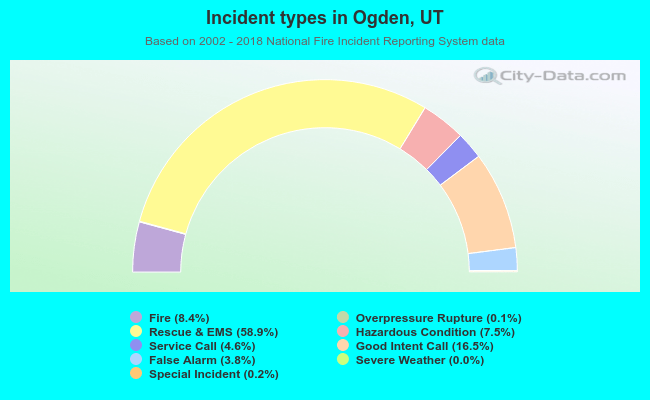 Out of all 49,101 cases reported during the years 2002 - 2018, the most belonged to the categories: Rescue & EMS (58.9%), Good Intent Call (16.5%), and Fire (8.4%).
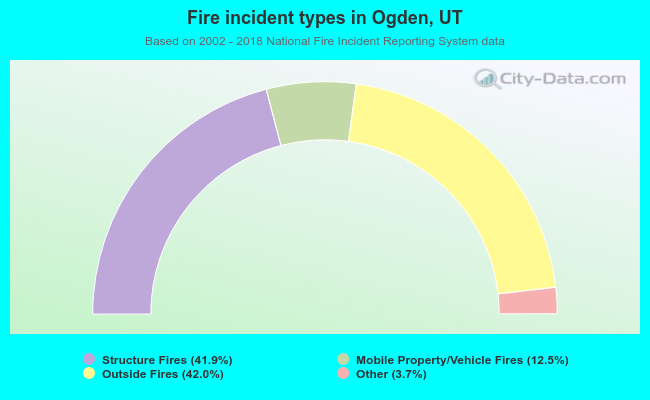 When looking into fire subcategories, the most incidents belonged to: Outside Fires (42.0%), and Structure Fires (41.9%).