Ottumwa: Fire Incidents, Iowa (IA)
Where are fire incidents reported in Ottumwa, IA
Something went wrong! Please refresh the page.
| Fire incidents reported | |
|---|---|
| Sreet name | Count |
| MAIN ST | 100 |
| ALBIA RD | 64 |
| SECOND ST | 54 |
| MAIN | 48 |
| SHERIDAN | 46 |
| COURT ST | 40 |
| IOWA AVE | 40 |
| DAVIS ST | 38 |
| MADISON AVE | 38 |
| RANSOM | 38 |
| COURT | 34 |
| MOORE | 34 |
| SECOND | 34 |
| MARY ST | 32 |
| WARD ST | 32 |
| LILLIAN | 30 |
| MABLE | 30 |
| MARY | 30 |
| MOORE ST | 30 |
| WARD | 30 |
| 120TH AVE | 28 |
| ASH | 28 |
| BLADENSBURG RD | 28 |
| JEFFERSON ST | 28 |
| LILLIAN ST | 28 |
| WILLARD | 28 |
| FELLOWS | 26 |
| FOURTH | 26 |
| LAKE RD | 26 |
| WILLIAMS | 26 |
| Other | 1,193 |
2002 - 2017 National Fire Incident Reporting System (NFIRS) incidents
- Incident types reported to NFIRS in Ottumwa, IA
- 8,96359.5%Rescue & EMS
- 2,28715.2%Fire
- 1,1787.8%Hazardous Condition
- 1,0116.7%Service Call
- 7454.9%Good Intent Call
- 5053.4%False Alarm
- 3522.3%Special Incident
- 200.1%Overpressure Rupture
- Fire incident types reported to NFIRS in Ottumwa, IA
- 1,47764.6%Outside Fires
- 45820.0%Structure Fires
- 26211.5%Mobile Property/Vehicle Fires
- 903.9%Other
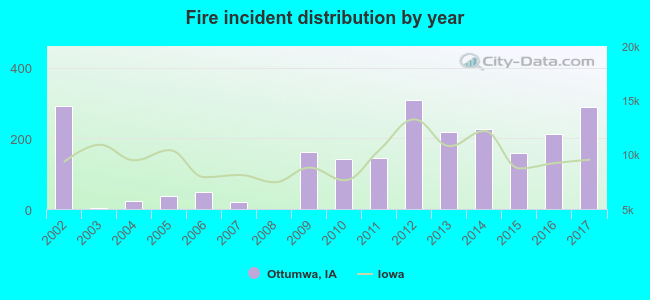 According to the data from the years 2002 - 2017 the average number of fire incidents per year is 143. The highest number of reported fire incidents - 308 took place in 2012, and the least - 1 in 2008. The data has a dropping trend.
The average number of yearly fire incidents per 10k residents in Ottumwa, IA compared to nearest cities:
(Note: Based on data for the last 3 years, including only cities with population 5,000 and above)
| Ottumwa: | 101.5 |
| Oskaloosa: | 40.1 |
| Fairfield: | 43.1 |
| Centerville: | 65.6 |
| Pella: | 33.2 |
 The median response time based on all reported fire incidents is 4 minutes. This is lower than the state median value.
The median response time in Ottumwa, IA compared to nearest cities:
(Note: Based on data for all years, including only cities with at least 500 fire incidents)
| Ottumwa: | 4 minutes |
| Oskaloosa: | 5 minutes |
| Fairfield: | 6 minutes |
| Centerville: | 4 minutes |
| Pella: | 9 minutes |
 Based on the data from the years 2002 - 2017 the average number of fire-related yearly deaths is 0. The highest number of reported deaths - 1 took place in 2002, and the lowest - 0 in 2003. The data has a declining trend.
 According to the data from the years 2002 - 2017 the average number of fire-related casualties per year is 1. The highest number of reported casualties - 6 took place in 2013, and the lowest - 0 in 2003. The data has an increasing trend.
The average number of injuries per 1,000 fires is 10. This indicator was the highest - 43 in 2004, and the lowest 0 in 2003. The trend for injuries per 1,000 incidents is increasing. Compared to the Iowa value the number of casualties per 1,000 fires is similar.
According to the data from the years 2002 - 2017 the average number of fire-related casualties per year is 1. The highest number of reported casualties - 6 took place in 2013, and the lowest - 0 in 2003. The data has an increasing trend.
The average number of injuries per 1,000 fires is 10. This indicator was the highest - 43 in 2004, and the lowest 0 in 2003. The trend for injuries per 1,000 incidents is increasing. Compared to the Iowa value the number of casualties per 1,000 fires is similar.Casualties per 1,000 incidents in Ottumwa, IA compared to nearest cities:
(Note: Based on data for all years, including only cities with at least 500 fire incidents)
| Ottumwa: | 9.6 |
| Oskaloosa: | 8.5 |
| Fairfield: | 0.0 |
| Centerville: | 22.1 |
| Pella: | 0.0 |
 27.7% incidents where reported in the morning and 72.3% in the evening. The most fires (16.7%) took place on Saturday, and the least (12.9%) on Thursday.
 Based on the 2,287 fire incident reports from years 2002 - 2017 most fires (10.5%) took place during March, and the least (5.2%) in December.
 Out of all 15,065 cases reported during the years 2002 - 2017, the most belonged to the categories: Rescue & EMS (59.5%), Fire (15.2%), and Hazardous Condition (7.8%).
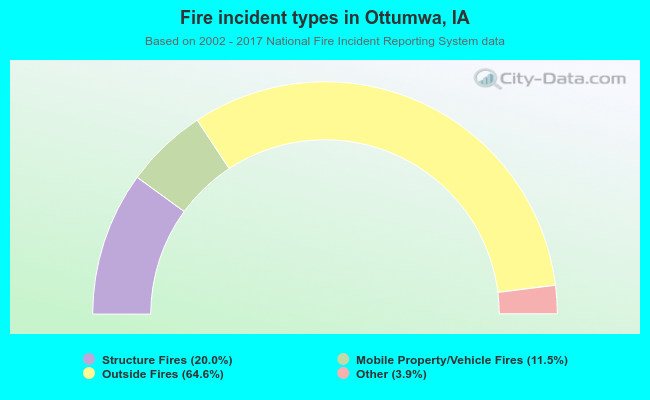 When looking into fire subcategories, the most incidents belonged to: Outside Fires (64.6%), and Structure Fires (20.0%).