Pachuta: Fire Incidents, Mississippi (MS)
Where are fire incidents reported in Pachuta, MS
Something went wrong! Please refresh the page.
|
| |||||||||||||||||||||||||||||||||||||||||||||||||||||||||||||||||||||||||||||||||||||||||||||||||||||||||||||
| Other | 73 | |||||||||||||||||||||||||||||||||||||||||||||||||||||||||||||||||||||||||||||||||||||||||||||||||||||||||||||
2002 - 2018 National Fire Incident Reporting System (NFIRS) incidents
- Incident types reported to NFIRS in Pachuta, MS
- 36948.0%Fire
- 27736.1%Rescue & EMS
- 496.4%Hazardous Condition
- 364.7%Good Intent Call
- 172.2%Service Call
- 91.2%False Alarm
- 60.8%Severe Weather
- 50.7%Special Incident
- Fire incident types reported to NFIRS in Pachuta, MS
- 13235.8%Outside Fires
- 11631.4%Other
- 10027.1%Structure Fires
- 215.7%Mobile Property/Vehicle Fires
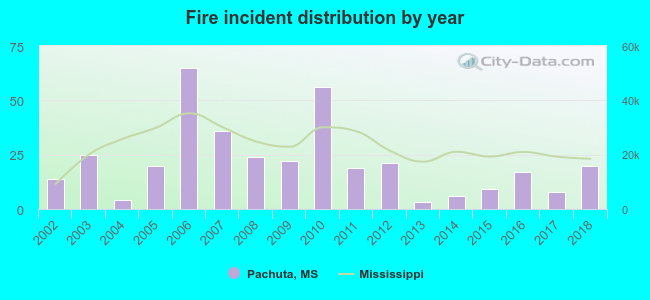 According to the data from the years 2002 - 2018 the average number of fires per year is 22. The highest number of fires - 65 took place in 2006, and the least - 3 in 2013. The data has a rising trend.
 30.4% incidents where reported in the morning and 69.6% in the evening. The most fires (16.3%) took place on Tuesday, and the least (12.7%) on Friday.
 According to the 369 fire incident reports from years 2002 - 2018 most fires (14.1%) took place during February, and the least (4.1%) in November.
 Out of all 768 cases reported during the years 2002 - 2018, the most belonged to the categories: Fire (48.0%), Overpressure Rupture (36.1%), and Rescue & EMS (6.4%).
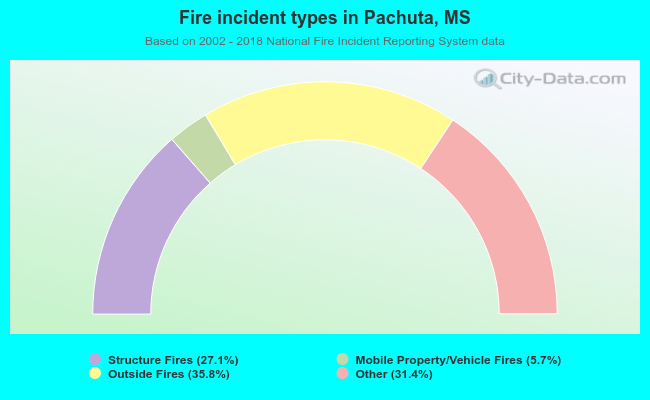 When looking into fire subcategories, the most reports belonged to: Outside Fires (35.8%), and Other (31.4%).