Paris: Fire Incidents, Arkansas (AR)
Where are fire incidents reported in Paris, AR
Something went wrong! Please refresh the page.
|
| |||||||||||||||||||||||||||||||||||||||||||||||||||||||||||||||||||||||||||||||||||||||||||||||||||||||||||||
| Other | 36 | |||||||||||||||||||||||||||||||||||||||||||||||||||||||||||||||||||||||||||||||||||||||||||||||||||||||||||||
2002 - 2018 National Fire Incident Reporting System (NFIRS) incidents
- Incident types reported to NFIRS in Paris, AR
- 37061.8%Fire
- 16627.7%Rescue & EMS
- 274.5%Good Intent Call
- 244.0%Hazardous Condition
- 50.8%Service Call
- 40.7%False Alarm
- 20.3%Severe Weather
- 10.2%Overpressure Rupture
- Fire incident types reported to NFIRS in Paris, AR
- 19452.4%Outside Fires
- 13135.4%Structure Fires
- 328.6%Mobile Property/Vehicle Fires
- 133.5%Other
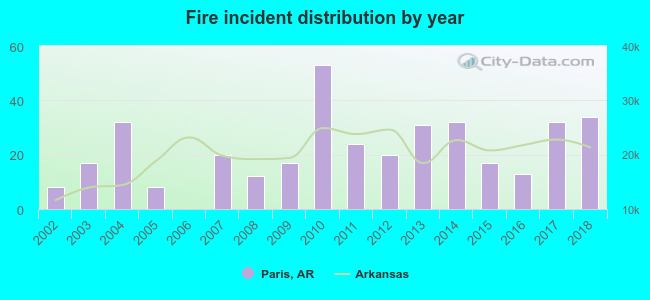 According to the data from the years 2002 - 2018 the average number of fire incidents per year is 22. The highest number of fire incidents - 53 took place in 2010, and the least - 0 in 2006. The data has a rising trend.
 33.5% incidents where reported in the morning and 66.5% in the evening. The most fires (17.6%) took place on Saturday, and the least (11.6%) on Thursday.
 Based on the 370 fire incidents from years 2002 - 2018 most fires (21.1%) took place during January, and the least (4.1%) in June.
 Out of all 599 cases reported during the years 2002 - 2018, the most belonged to the categories: Fire (61.8%), Rescue & EMS (27.7%), and Good Intent Call (4.5%).
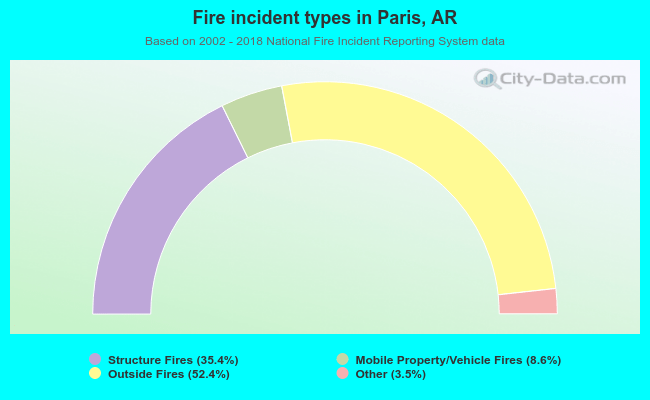 When looking into fire subcategories, the most incidents belonged to: Outside Fires (52.4%), and Structure Fires (35.4%).