| Fire incidents reported |
|---|
| Sreet name | Count |
|---|
| 4TH STREET ST | 8 | | 101 PINE STREET COR | 6 | | ELM ST | 6 | | 120TH STREET | 4 | | 160TH AVE | 4 | | 30 AVE | 4 | | 30TH AVE | 4 | | 460TH ST ST | 4 | | 460TH STREET | 4 | | 4730 470TH ST ST | 4 | | ELM STREET | 4 | | 1 MILE M27 | 2 | | 10 HWY | 2 | | 100 AVE & HWY 10 AVE | 2 | | 100 MAIN ST ST | 2 | | 1020 460TH ST ST | 2 | | 1050 460TH STREET ST | 2 | | 105TH AVE. | 2 | | 109 E 3RD ST ST | 2 | | 110TH STREET | 2 | | 120TH AVE RD | 2 | | 130TH AVE | 2 | | 140TH STREET | 2 | | 150TH AVE & 500TH STREET | 2 | | 160 TH AVE | 2 |
| | | Fire incidents reported |
|---|
| Sreet name | Count |
|---|
| 160TH AVE | 2 | | 160TH AVE & 510TH STREET | 2 | | 1660 460TH STREET RD | 2 | | 180TH AVE | 2 | | 1ST ST | 2 | | 2 MILES SOUTH M27 | 2 | | 201 PINE ST ST | 2 | | 20TH AVE & HWY. M27 AVE | 2 | | 20TH AVENUE | 2 | | 210TH AVE. RD | 2 | | 250 SOUTH RIVER ROAD RD | 2 | | 2ND STREET | 2 | | 30TH AVE AVE | 2 | | 319 ELM STREET | 2 | | 3RD STREET ST | 2 | | 403 4TH STREET | 2 | | 405 CHURCH ST ST | 2 | | 414 3RD ST ST | 2 | | 4424 20TH AVE AVE | 2 | | 4430 HWY 71 HWY | 2 | | 450TH STREET AND W AVE | 2 | | 4590 20TH AVE AVE | 2 | | 460TH AND YELLOW AVE PR | 2 | | 460TH STREET & 120TH AVE | 2 | | |
|
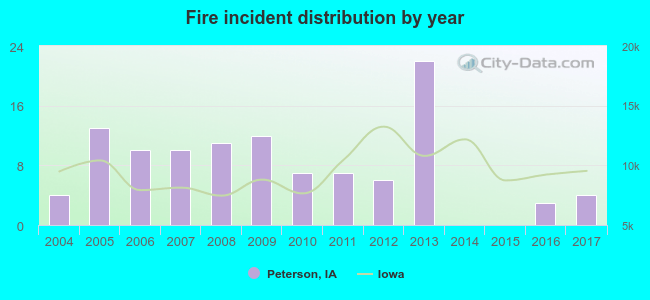 According to the data from the years 2004 - 2017 the average number of fires per year is 8. The highest number of reported fire incidents - 22 took place in 2013, and the least - 0 in 2014. The data has a constant trend.
 24.8% incidents where reported in the morning and 75.2% in the evening. The most fires (20.2%) took place on Saturday, and the least (9.2%) on Monday.
 Based on the 109 reports from years 2004 - 2017 most fires (24.8%) took place during April, and the least (0.9%) in February.
 Out of all 135 cases reported during the years 2004 - 2017, the most belonged to the categories: Fire (80.7%), Rescue & EMS (6.7%), and Service Call (5.2%).
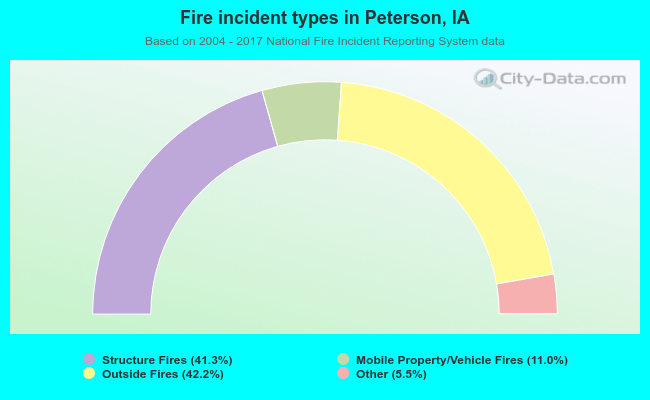 When looking into fire subcategories, the most reports belonged to: Outside Fires (42.2%), and Structure Fires (41.3%).