| Fire incidents reported |
|---|
| Sreet name | Count |
|---|
| HWY 88 | 70 | | RIDGE ROAD | 64 | | TABEAUD ROAD | 24 | | CLINTON ROAD | 20 | | IRISHTOWN ROAD | 16 | | CLIMAX ROAD | 14 | | HIGHWAY 88 | 14 | | AQUEDUCT ROAD | 12 | | MEADOWBROOK DRIVE | 10 | | MIERKEY ROAD | 10 | | MURPHY ROAD | 10 | | PINE GROVE VOLCANO ROAD | 10 | | BOWMAN ROAD | 8 | | GOLD STRIKE ROAD | 8 | | NEW YORK RANCH ROAD | 8 | | RIDGE VIEW DRIVE | 8 | | SUGAR PINE DRIVE | 8 | | SURREY JUNCTION LANE | 8 | | TIMBER RIDGE ROAD | 8 | | AMADOR LANE | 6 | | AQUEDUCT GROVE | 6 | | BERRY STREET | 6 | | LUPE ROAD | 6 | | MITCHELL MINE ROAD | 6 | | MOUNTAIN VIEW DRIVE | 6 |
| | | Fire incidents reported |
|---|
| Sreet name | Count |
|---|
| NEW YORK RANCH RD | 6 | | PIONEER DRIVE | 6 | | TOMA LANE | 6 | | TOYON ROAD | 6 | | BATES ROAD | 4 | | BURNT CEDAR LANE | 4 | | CLIMAX RD | 4 | | CLINTON BAR ROAD | 4 | | CRESTVIEW DRIVE | 4 | | DEBBIE LANE | 4 | | DOGWOOD COURT | 4 | | EMILY WAY | 4 | | FOOTHILL PINES COURT | 4 | | GOLD MINE ROAD | 4 | | GOLD VIEW WAY | 4 | | HOLLY PLACE | 4 | | HOMESTEAD ROAD | 4 | | LEONA LANE | 4 | | MOLFINO ROAD | 4 | | NARCISSUS ROAD | 4 | | OAK LANE | 4 | | PALAMINO ROAD | 4 | | PAYTON LANE | 4 | | PONDEROSA WAY | 4 | | QUAIL DRIVE | 4 |
|
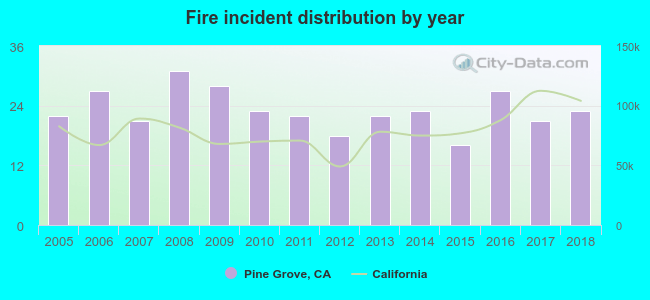 Based on the data from the years 2005 - 2018 the average number of fire incidents per year is 23. The highest number of fire incidents - 31 took place in 2008, and the least - 16 in 2015. The data has a rising trend.
 31.2% incidents where reported in the morning and 68.8% in the evening. The most fires (18.5%) took place on Saturday, and the least (10.2%) on Thursday.
 Based on the 324 fire incidents from years 2005 - 2018 most fires (10.2%) took place during December, and the least (6.2%) in February.
 Out of all 3,061 cases reported during the years 2005 - 2018, the most belonged to the categories: Rescue & EMS (59.3%), Service Call (15.0%), and Fire (10.6%).
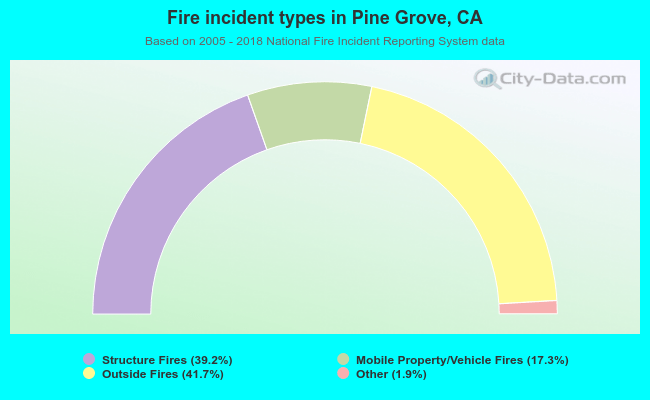 When looking into fire subcategories, the most reports belonged to: Outside Fires (41.7%), and Structure Fires (39.2%).