Pineville: Fire Incidents, Louisiana (LA)
Where are fire incidents reported in Pineville, LA
Something went wrong! Please refresh the page.
| Fire incidents reported | |
|---|---|
| Sreet name | Count |
| SHREVEPORT HWY | 190 |
| OLD MARKSVILLE HWY | 164 |
| MONROE HWY | 118 |
| HWY 28 / LA SR 28 HWY | 98 |
| PHILADELPHIA RD | 82 |
| HWY 454 HWY | 78 |
| WILLIAMS LAKE RD | 76 |
| PALMER CHAPEL RD | 74 |
| HIGHWAY 28 | 72 |
| MILITARY HWY | 72 |
| DONAHUE FERRY RD | 68 |
| EDGEWOOD DR | 66 |
| HWY 1204 HWY | 64 |
| ESLER FIELD RD | 62 |
| BAYOU MARIE RD | 58 |
| HIGHWAY 28 HWY | 58 |
| HOOPER RD | 54 |
| DENNY RD | 52 |
| HWY 28 LA SR 28 HWY | 52 |
| DUPREE ST | 44 |
| OAKLANE RD | 42 |
| COTTINGHAM EXPY | 40 |
| HICKORY HILL RD | 40 |
| MARYHILL RD | 38 |
| STILLEY RD | 36 |
| EXPRESSWAY DR | 34 |
| MELROSE ST | 34 |
| SUSEK DR | 34 |
| WASHBOARD RD | 30 |
| 2495 SHREVEPORT HWY 71 N HWY | 28 |
| Other | 1,298 |
2002 - 2018 National Fire Incident Reporting System (NFIRS) incidents
- Incident types reported to NFIRS in Pineville, LA
- 11,58058.5%Rescue & EMS
- 3,25616.5%Fire
- 1,8199.2%Good Intent Call
- 1,3176.7%Hazardous Condition
- 9815.0%Service Call
- 7553.8%False Alarm
- 490.2%Severe Weather
- Fire incident types reported to NFIRS in Pineville, LA
- 1,61649.6%Outside Fires
- 1,09133.5%Structure Fires
- 33010.1%Mobile Property/Vehicle Fires
- 2196.7%Other
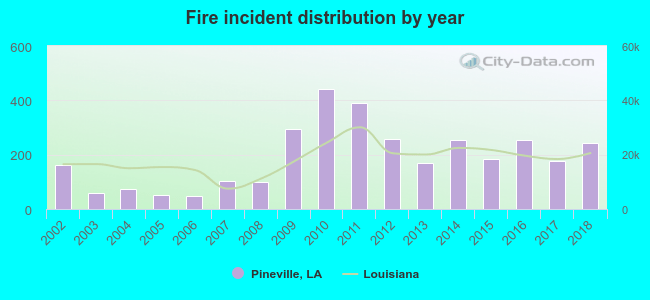 According to the data from the years 2002 - 2018 the average number of fire incidents per year is 192. The highest number of fire incidents - 441 took place in 2010, and the least - 47 in 2006. The data has a rising trend.
The average number of yearly fire incidents per 10k residents in Pineville, LA compared to nearest cities:
(Note: Based on data for the last 3 years, including only cities with population 5,000 and above)
| Pineville: | 155.1 |
| Alexandria: | 83.9 |
| Marksville: | 79.2 |
| Oakdale: | 115.7 |
| Ville Platte: | 100.2 |
| Natchitoches: | 76.7 |
| Leesville: | 200.7 |
 The median response time based on all reported fire incidents is 6 minutes. This is about the same as the state median value.
The median response time in Pineville, LA compared to nearest cities:
(Note: Based on data for all years, including only cities with at least 500 fire incidents)
| Pineville: | 6 minutes |
| Alexandria: | 5 minutes |
| Pollock: | 12 minutes |
| Deville: | 10 minutes |
| Boyce: | 10 minutes |
| Glenmora: | 9 minutes |
| Jena: | 5 minutes |
| Oakdale: | 5 minutes |
| Winnfield: | 8 minutes |
 According to the reports from the years 2002 - 2018 the average number of fire-related fatalities per year is 0. The highest number of reported deaths - 2 took place in 2015, and the lowest - 0 in 2002. The data has a constant trend.
The average number of deaths per 1,000 fire incidents is 2. This indicator was the highest - 11 in 2015, and the lowest 0 in 2002. The trend for deaths per 1,000 fires is constant. Compared to the state value the number of fatalities per 1,000 fire incidents is lower.
According to the reports from the years 2002 - 2018 the average number of fire-related fatalities per year is 0. The highest number of reported deaths - 2 took place in 2015, and the lowest - 0 in 2002. The data has a constant trend.
The average number of deaths per 1,000 fire incidents is 2. This indicator was the highest - 11 in 2015, and the lowest 0 in 2002. The trend for deaths per 1,000 fires is constant. Compared to the state value the number of fatalities per 1,000 fire incidents is lower.Deaths per 1,000 incidents in Pineville, LA compared to nearest cities:
(Note: Based on data for all years, including only cities with at least 2,500 fire incidents)
| Pineville: | 1.2 |
| Alexandria: | 1.1 |
 Based on the reports from the years 2002 - 2018 the average number of fire-related casualties per year is 1. The highest number of reported injuries - 4 took place in 2009, and the lowest - 0 in 2003. The data has a growing trend.
The average number of injuries per 1,000 fires is 4. This indicator was the highest - 14 in 2009, and the lowest 0 in 2003. The trend for injuries per 1,000 incidents is rising. Compared to the state value the number of casualties per 1,000 fires is similar.
Based on the reports from the years 2002 - 2018 the average number of fire-related casualties per year is 1. The highest number of reported injuries - 4 took place in 2009, and the lowest - 0 in 2003. The data has a growing trend.
The average number of injuries per 1,000 fires is 4. This indicator was the highest - 14 in 2009, and the lowest 0 in 2003. The trend for injuries per 1,000 incidents is rising. Compared to the state value the number of casualties per 1,000 fires is similar.
 27.1% incidents where reported in the morning and 72.9% in the evening. The most fires (15.9%) took place on Saturday, and the least (12.3%) on Wednesday.
 Based on the 3,256 incident reports from years 2002 - 2018 most fires (11.0%) took place during February, and the least (6.4%) in April.
 Out of all 19,781 cases reported during the years 2002 - 2018, the most belonged to the categories: Rescue & EMS (58.5%), Fire (16.5%), and Good Intent Call (9.2%).
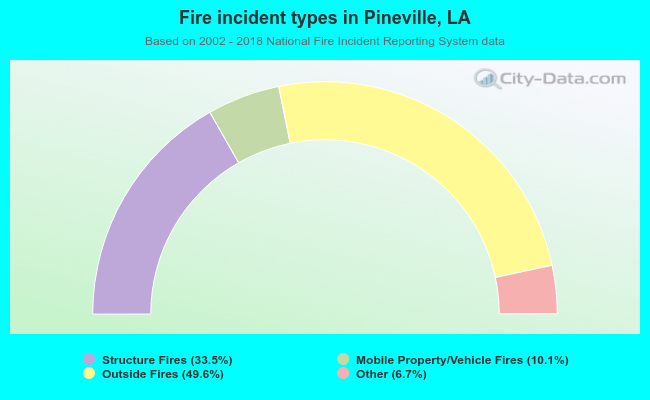 When looking into fire subcategories, the most incidents belonged to: Outside Fires (49.6%), and Structure Fires (33.5%).