Port Townsend: Fire Incidents, Washington (WA)
Where are fire incidents reported in Port Townsend, WA
Something went wrong! Please refresh the page.
| Fire incidents reported | |
|---|---|
| Sreet name | Count |
| HANCOCK ST | 140 |
| SIMS WAY | 96 |
| DISCOVERY RD | 72 |
| WATER ST | 62 |
| WASHINGTON ST | 56 |
| CAPE GEORGE RD | 52 |
| LAWRENCE ST | 44 |
| SAN JUAN AVE | 42 |
| CLAY ST | 36 |
| HWY 101 | 34 |
| HWY 20 | 34 |
| TAYLOR ST | 34 |
| HASTINGS AVE | 32 |
| HENDRICKS ST | 30 |
| MARTIN RD | 30 |
| ADELMA BEACH RD | 26 |
| SHERIDAN ST | 26 |
| FOUR CORNERS RD | 24 |
| GRANT ST | 24 |
| THOMAS ST | 24 |
| BECKETT POINT RD | 22 |
| CRUTCHER RD | 22 |
| HUDSON ST | 20 |
| MONROE ST | 20 |
| JACOB MILLER RD | 18 |
| OLD EAGLEMOUNT RD | 18 |
| ADAMS ST | 16 |
| AIRPORT CUTOFF RD | 16 |
| BATTERY WAY | 16 |
| KEARNEY ST | 16 |
| Other | 226 |
2002 - 2018 National Fire Incident Reporting System (NFIRS) incidents
- Incident types reported to NFIRS in Port Townsend, WA
- 8,15561.0%Rescue & EMS
- 1,34010.0%Service Call
- 1,3289.9%Fire
- 1,1118.3%Good Intent Call
- 8306.2%Hazardous Condition
- 5524.1%False Alarm
- 280.2%Overpressure Rupture
- 250.2%Special Incident
- Fire incident types reported to NFIRS in Port Townsend, WA
- 73555.3%Structure Fires
- 34425.9%Outside Fires
- 18614.0%Mobile Property/Vehicle Fires
- 634.7%Other
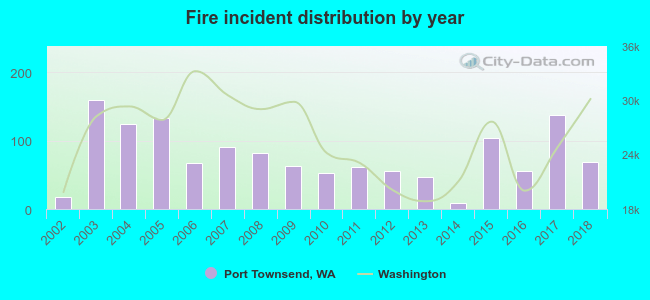 According to the data from the years 2002 - 2018 the average number of fires per year is 78. The highest number of reported fires - 159 took place in 2003, and the least - 9 in 2014. The data has a rising trend.
The average number of yearly fire incidents per 10k residents in Port Townsend, WA compared to nearest cities:
(Note: Based on data for the last 3 years, including only cities with population 5,000 and above)
| Port Townsend: | 94.4 |
| Discovery Bay: | 2.2 |
| Oak Harbor: | 43.0 |
| Sequim: | 48.5 |
| Stanwood: | 41.5 |
| Mukilteo: | 18.9 |
| Poulsbo: | 74.6 |
| Anacortes: | 66.5 |
| Marysville: | 19.5 |
 The median response time based on all reported fire incidents is 7 minutes. This is close to the Washington median value.
The median response time in Port Townsend, WA compared to nearest cities:
(Note: Based on data for all years, including only cities with at least 500 fire incidents)
| Port Townsend: | 7 minutes |
| Oak Harbor: | 5 minutes |
| Sequim: | 7 minutes |
| Quilcene: | 13 minutes |
| Stanwood: | 8 minutes |
| Mukilteo: | 6 minutes |
| Poulsbo: | 8 minutes |
| Anacortes: | 7 minutes |
| Marysville: | 7 minutes |
 Based on the reports from the years 2002 - 2018 the average number of fire-related yearly deaths is 0. The highest number of deaths - 3 took place in 2006, and the lowest - 0 in 2002. The data has a constant trend.
 Based on the reports from the years 2002 - 2018 the average number of fire-related casualties per year is 0. The highest number of casualties - 2 took place in 2004, and the lowest - 0 in 2002. The data has a constant trend.
The average number of casualties per 1,000 fire incidents is 5. This indicator was the highest - 19 in 2010, and the lowest 0 in 2002. The trend for casualties per 1,000 incidents is constant. Compared to the state value the number of injuries per 1,000 fires is lower.
Based on the reports from the years 2002 - 2018 the average number of fire-related casualties per year is 0. The highest number of casualties - 2 took place in 2004, and the lowest - 0 in 2002. The data has a constant trend.
The average number of casualties per 1,000 fire incidents is 5. This indicator was the highest - 19 in 2010, and the lowest 0 in 2002. The trend for casualties per 1,000 incidents is constant. Compared to the state value the number of injuries per 1,000 fires is lower.Casualties per 1,000 incidents in Port Townsend, WA compared to nearest cities:
(Note: Based on data for all years, including only cities with at least 500 fire incidents)
| Port Townsend: | 5.3 |
| Oak Harbor: | 9.9 |
| Sequim: | 1.1 |
| Quilcene: | 0.0 |
| Stanwood: | 0.5 |
| Mukilteo: | 19.2 |
| Poulsbo: | 6.0 |
| Anacortes: | 6.2 |
| Marysville: | 7.1 |
 33.1% incidents where reported in the morning and 66.9% in the evening. The most fires (17.2%) took place on Thursday, and the least (12.2%) on Tuesday.
 According to the 1,328 incident reports from years 2002 - 2018 most fires (14.5%) took place during July, and the least (6.1%) in October.
 Out of all 13,373 cases reported during the years 2002 - 2018, the most belonged to the categories: Rescue & EMS (61.0%), Service Call (10.0%), and Fire (9.9%).
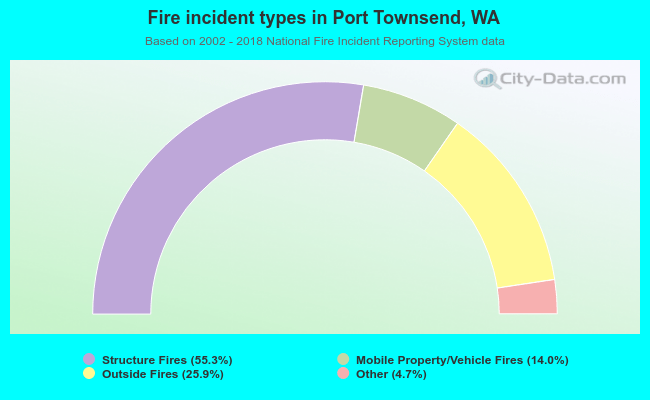 When looking into fire subcategories, the most reports belonged to: Structure Fires (55.3%), and Outside Fires (25.9%).