Red Bluff: Fire Incidents, California (CA)
Where are fire incidents reported in Red Bluff, CA
Something went wrong! Please refresh the page.
| Fire incidents reported | |
|---|---|
| Sreet name | Count |
| SOUTH MAIN ST | 178 |
| ANTELOPE BLVD | 136 |
| MAIN ST | 96 |
| I5 FWY | 88 |
| DIAMOND AVE | 86 |
| WALNUT ST | 86 |
| KIMBALL RD | 56 |
| MONROE ST | 56 |
| LUTHER RD | 50 |
| RIVERSIDE WAY | 46 |
| I-5 FWY | 40 |
| HIGHWAY 99 | 36 |
| BAKER RD | 34 |
| LIVE OAK RD | 34 |
| SOUTH JACKSON ST | 32 |
| BELLE MILL RD | 30 |
| HIGHWAY 36 | 30 |
| HWY 99 HWY | 30 |
| MADISON ST | 30 |
| PASKENTA RD | 30 |
| ADOBE RD | 28 |
| JOHNSON ST | 28 |
| SALE LANE | 28 |
| GILMORE RD | 26 |
| DERBY RD | 22 |
| LAKESIDE DR | 22 |
| VISTA WAY | 22 |
| LINCOLN ST | 20 |
| MONTGOMERY RD | 20 |
| ORANGE ST | 20 |
| Other | 146 |
2006 - 2018 National Fire Incident Reporting System (NFIRS) incidents
- Incident types reported to NFIRS in Red Bluff, CA
- 12,07966.8%Rescue & EMS
- 1,83310.1%Service Call
- 1,5998.8%Good Intent Call
- 1,5868.8%Fire
- 5413.0%Hazardous Condition
- 4312.4%False Alarm
- Fire incident types reported to NFIRS in Red Bluff, CA
- 85053.6%Outside Fires
- 45428.6%Structure Fires
- 21813.7%Mobile Property/Vehicle Fires
- 644.0%Other
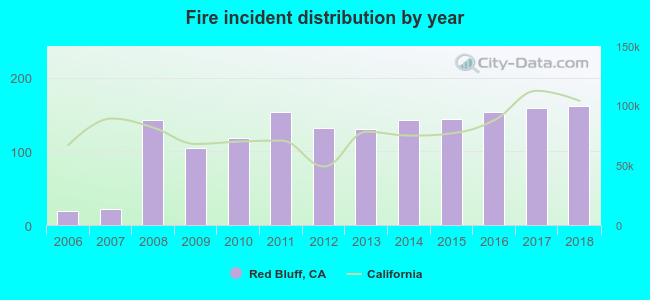 Based on the data from the years 2006 - 2018 the average number of fires per year is 122. The highest number of reported fires - 162 took place in 2018, and the least - 19 in 2006. The data has an increasing trend.
The average number of yearly fire incidents per 10k residents in Red Bluff, CA compared to nearest cities:
(Note: Based on data for the last 3 years, including only cities with population 5,000 and above)
| Red Bluff: | 112.4 |
| Corning: | 53.4 |
| Anderson: | 97.6 |
| Redding: | 33.0 |
| Orland: | 1.8 |
| Shasta Lake: | 2.6 |
| Chico: | 40.1 |
| Magalia: | 0.9 |
| Durham: | 19.9 |
 The median response time based on all reported fire incidents is 4 minutes. This is lower compared to the California median value.
The median response time in Red Bluff, CA compared to nearest cities:
(Note: Based on data for all years, including only cities with at least 500 fire incidents)
| Red Bluff: | 4 minutes |
| Cottonwood: | 8 minutes |
| Corning: | 10 minutes |
| Anderson: | 6 minutes |
| Redding: | 8 minutes |
| Chico: | 5 minutes |
| Paradise: | 4 minutes |
| Willows: | 5 minutes |
| Oroville: | 4 minutes |
 Based on the data from the years 2006 - 2018 the average number of fire-related yearly deaths is 0. The highest number of deaths - 3 took place in 2013, and the lowest - 0 in 2006. The data has a constant trend.
 According to the reports from the years 2006 - 2018 the average number of fire-related casualties per year is 1. The highest number of reported injuries - 3 took place in 2016, and the lowest - 0 in 2006. The data has a rising trend.
The average number of casualties per 1,000 fire incidents is 7. This indicator was the highest - 20 in 2016, and the lowest 0 in 2006. The trend for casualties per 1,000 fires is rising. Compared to the state value the number of casualties per 1,000 fire incidents is higher.
According to the reports from the years 2006 - 2018 the average number of fire-related casualties per year is 1. The highest number of reported injuries - 3 took place in 2016, and the lowest - 0 in 2006. The data has a rising trend.
The average number of casualties per 1,000 fire incidents is 7. This indicator was the highest - 20 in 2016, and the lowest 0 in 2006. The trend for casualties per 1,000 fires is rising. Compared to the state value the number of casualties per 1,000 fire incidents is higher.
 34.4% incidents where reported in the morning and 65.6% in the evening. The most fires (15.2%) took place on Saturday, and the least (12.5%) on Wednesday.
 According to the 1,586 incident reports from years 2006 - 2018 most fires (12.4%) took place during July, and the least (5.2%) in February.
 Out of all 18,094 cases reported during the years 2006 - 2018, the most belonged to the categories: Rescue & EMS (66.8%), Service Call (10.1%), and Good Intent Call (8.8%).
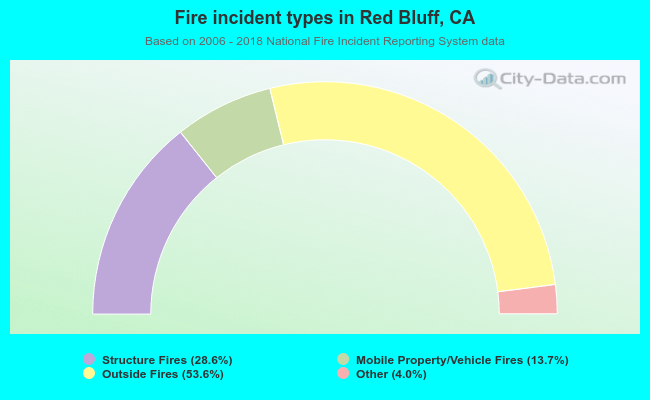 When looking into fire subcategories, the most incidents belonged to: Outside Fires (53.6%), and Structure Fires (28.6%).