| Fire incidents reported |
|---|
| Sreet name | Count |
|---|
| NCTR RD | 26 | | HWY 365 | 20 | | I-530 | 20 | | HWY 530 | 18 | | GRANT 58 | 8 | | HWY 365 SOUTH | 8 | | I530 | 8 | | OLIVE ST | 8 | | OSAGE DR | 8 | | 8864 GRANT 58 | 6 | | HWY 530 | 6 | | HWY 530 HWY | 6 | | RIVER RD | 6 | | RIVER ROAD | 6 | | 238 GRANT 4601 | 4 | | 2690 GRANT 61 | 4 | | 2800 AKIN LANE | 4 | | 481 DEERBROOK | 4 | | ALEX LOOP | 4 | | BARLETT RD | 4 | | BECKY LN | 4 | | CHANEY RD | 4 | | HUNTER | 4 | | HWY 530 FWY | 4 | | JOANETTE RD | 4 |
| | | Fire incidents reported |
|---|
| Sreet name | Count |
|---|
| MAIL ROUTE ROAD | 4 | | SHERIDAN RD | 4 | | STAGE COACH ROAD | 4 | | STAGECOACH RD | 4 | | STUCKY TRAIL | 4 | | UNKNOWN | 4 | | WHITE BLUFF | 4 | | WHITE BLUFF RD | 4 | | #6 COZY LANE | 2 | | 103 GRANT 581 | 2 | | 1138 RUBY DRIVE | 2 | | 119 DEER BROOK | 2 | | 1321 GRANT 61 | 2 | | 1388 HOPPER RD | 2 | | 14 GT 585 1 | 2 | | 1510 MAIL ROUTE ROAD | 2 | | 1921 OATS RD | 2 | | 206 BROACKMAN RD | 2 | | 211 NCTR | 2 | | 2173 GRANT 75 | 2 | | 22 CULWOOD DR. | 2 | | 237 GRANT 4608 | 2 | | 265 PRICES ROAD | 2 | | 2800 BLOCK STAGECOACH | 2 | | 316 PRICES RD | 2 |
|
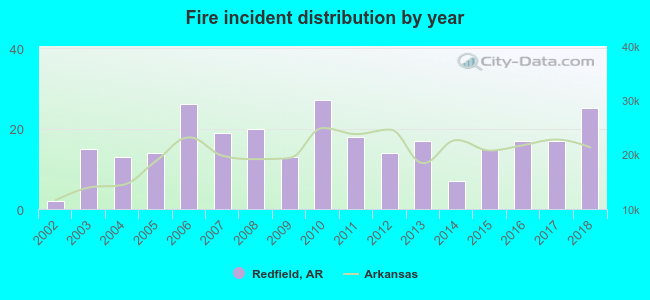 Based on the data from the years 2002 - 2018 the average number of fires per year is 16. The highest number of fires - 27 took place in 2010, and the least - 2 in 2002. The data has a rising trend.
 32.3% incidents where reported in the morning and 67.7% in the evening. The most fires (17.2%) took place on Friday, and the least (10.8%) on Monday.
 Based on the 279 fire incidents from years 2002 - 2018 most fires (16.1%) took place during March, and the least (5.0%) in December.
 Out of all 1,055 cases reported during the years 2002 - 2018, the most belonged to the categories: Overpressure Rupture (56.9%), Fire (26.4%), and Service Call (6.4%).
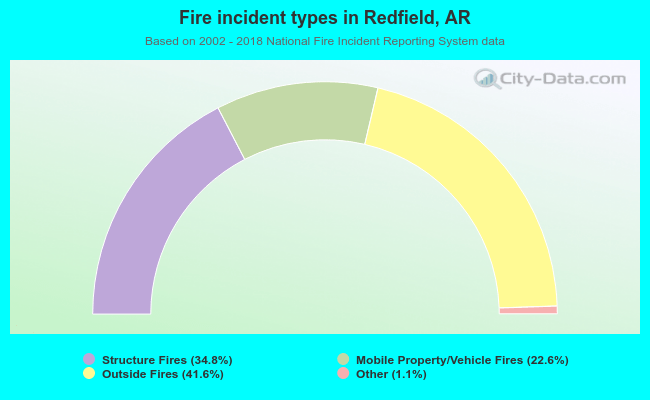 When looking into fire subcategories, the most reports belonged to: Outside Fires (41.6%), and Structure Fires (34.8%).