Ridgeland: Fire Incidents, Mississippi (MS)
Where are fire incidents reported in Ridgeland, MS
Something went wrong! Please refresh the page.
| Fire incidents reported | |
|---|---|
| Sreet name | Count |
| COUNTY LINE RD | 188 |
| OLD CANTON RD | 130 |
| PINE KNOLL DR | 112 |
| PEAR ORCHARD RD | 110 |
| HWY 51 | 82 |
| WILLIAM BLVD | 80 |
| HIGHLAND COLONY PKY | 70 |
| WHEATLEY ST | 54 |
| JACKSON ST | 50 |
| I-55 | 48 |
| LAKE HARBOUR DR | 48 |
| RICE RD | 40 |
| ARBOR DR | 38 |
| I55 | 34 |
| LIVINGSTON RD | 30 |
| GLASTONBURY CIR | 28 |
| I220 | 28 |
| LAKE HARBOR DR | 26 |
| COTTONWOOD DR | 24 |
| HICKORY RD | 24 |
| I-55 HWY | 24 |
| RICHARDSON RD | 24 |
| LAKE HARBOUR | 22 |
| WILLIAMS BLVD | 22 |
| LAKE SHORE DR | 20 |
| COUNTYLINE RD | 18 |
| RIDGEWOOD RD | 18 |
| I-220 | 16 |
| LENARD AVE | 16 |
| SUNNYBROOK RD | 16 |
| Other | 114 |
2002 - 2018 National Fire Incident Reporting System (NFIRS) incidents
- Incident types reported to NFIRS in Ridgeland, MS
- 11,75766.4%Rescue & EMS
- 1,5548.8%Fire
- 1,4057.9%Service Call
- 1,1786.7%Hazardous Condition
- 1,0596.0%False Alarm
- 6913.9%Good Intent Call
- 250.1%Overpressure Rupture
- Fire incident types reported to NFIRS in Ridgeland, MS
- 62540.2%Outside Fires
- 47430.5%Structure Fires
- 33421.5%Mobile Property/Vehicle Fires
- 1217.8%Other
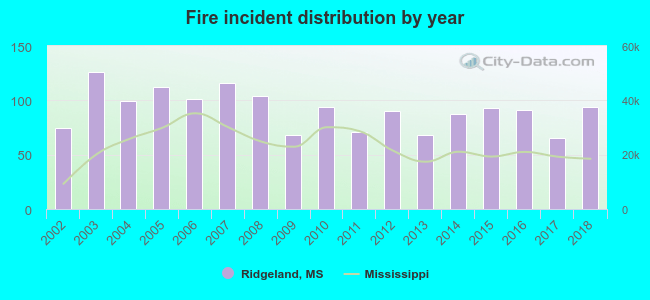 Based on the data from the years 2002 - 2018 the average number of fire incidents per year is 91. The highest number of reported fires - 126 took place in 2003, and the least - 65 in 2017. The data has an increasing trend.
The average number of yearly fire incidents per 10k residents in Ridgeland, MS compared to nearest cities:
(Note: Based on data for the last 3 years, including only cities with population 5,000 and above)
| Ridgeland: | 34.4 |
| Madison: | 40.1 |
| Flowood: | 56.9 |
| Jackson: | 25.9 |
| Pearl: | 32.7 |
| Brandon: | 99.6 |
| Clinton: | 27.8 |
| Richland: | 54.7 |
| Canton: | 151.2 |
 The median response time based on all reported fire incidents is 4 minutes. This is lower than the state median value.
The median response time in Ridgeland, MS compared to nearest cities:
(Note: Based on data for all years, including only cities with at least 500 fire incidents)
| Ridgeland: | 4 minutes |
| Madison: | 5 minutes |
| Flowood: | 4 minutes |
| Jackson: | 5 minutes |
| Pearl: | 4 minutes |
| Brandon: | 7 minutes |
| Clinton: | 5 minutes |
| Richland: | 3 minutes |
| Flora: | 8 minutes |
 28.4% incidents where reported in the morning and 71.6% in the evening. The most fires (15.6%) took place on Sunday, and the least (13.3%) on Friday.
 According to the 1,554 incident reports from years 2002 - 2018 most fires (9.4%) took place during October, and the least (7.3%) in June.
 Out of all 17,696 cases reported during the years 2002 - 2018, the most belonged to the categories: Rescue & EMS (66.4%), Fire (8.8%), and Service Call (7.9%).
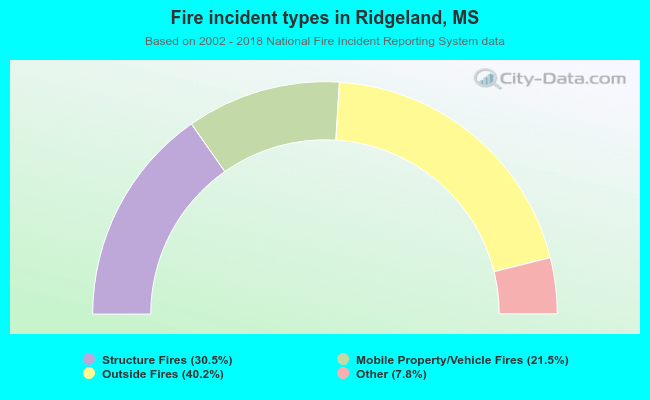 When looking into fire subcategories, the most reports belonged to: Outside Fires (40.2%), and Structure Fires (30.5%).