| Fire incidents reported |
|---|
| Sreet name | Count |
|---|
| ROCKINGHAM RD | 20 | | MISSING LINK RD | 18 | | PARKER HILL RD | 12 | | PLEASANT VALLEY RD | 12 | | OLD RIVER RD | 10 | | RT 103 | 10 | | PARKER HILL RD | 8 | | ROCKINGHAM RD | 8 | | DARBY HILL RD | 6 | | I91 N | 6 | | MISSING LINK RD | 6 | | OLD RIVER RD | 6 | | ROUNDS RD | 6 | | ROUNDS ROAD | 6 | | TOWN FARM RD | 6 | | BARTONSVILLE RD | 4 | | CAMBRIDGEPORT RD | 4 | | CAMBRIDGEPORT RD | 4 | | GOLDEN HILL RD | 4 | | IMTEC LN | 4 | | LOWER BARTONSVILLE RD | 4 | | OLD RIVER RD. | 4 | | ROUNDS RD | 4 | | ROUTE 91 S | 4 | | SAXTONS RIVER RD | 4 |
| | | Fire incidents reported |
|---|
| Sreet name | Count |
|---|
| WEBB TER | 4 | | 136 OBRIEN RD. | 2 | | 14 COLLEY HOLLOW RD | 2 | | 15 ROCKINGHAM ST. | 2 | | 16 RIPPLE LN | 2 | | 18 RIPPLE LANE | 2 | | 205 DARBY HILL RD | 2 | | 217 DARBY HILL RD | 2 | | 35 COLLEY HOLLOW RD | 2 | | 39 OLD RIVER RD | 2 | | 492 MISSING LINK RD. | 2 | | 624 PLEASANT VALLEY RD | 2 | | 7 MEETING HOUSE RD | 2 | | 7 MEETING HOUSE RD. | 2 | | 8 NORTHSHORE DR | 2 | | 9 MEETING HOUSE RD. | 2 | | ALDEN RD | 2 | | ANDERSON RD | 2 | | BARBERS PARK | 2 | | BAZANCIN RD | 2 | | BROCKWAY MILL RD | 2 | | BROCKWAYS MILLS RD | 2 | | CAMBRIDGEPORT ROAD | 2 | | COLLEY HOLLOW RD | 2 | | |
|
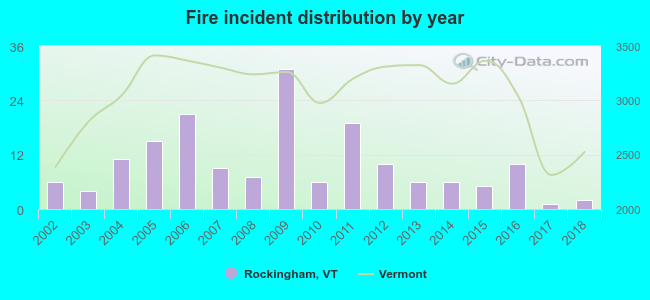 According to the data from the years 2002 - 2018 the average number of fires per year is 10. The highest number of fire incidents - 31 took place in 2009, and the least - 1 in 2017. The data has a declining trend.
 34.9% incidents where reported in the morning and 65.1% in the evening. The most fires (18.9%) took place on Saturday, and the least (8.9%) on Friday.
 According to the 169 fires from years 2002 - 2018 most fires (18.9%) took place during April, and the least (3.6%) in February.
 Out of all 656 cases reported during the years 2002 - 2018, the most belonged to the categories: Rescue & EMS (29.3%), Overpressure Rupture (27.4%), and Fire (25.8%).
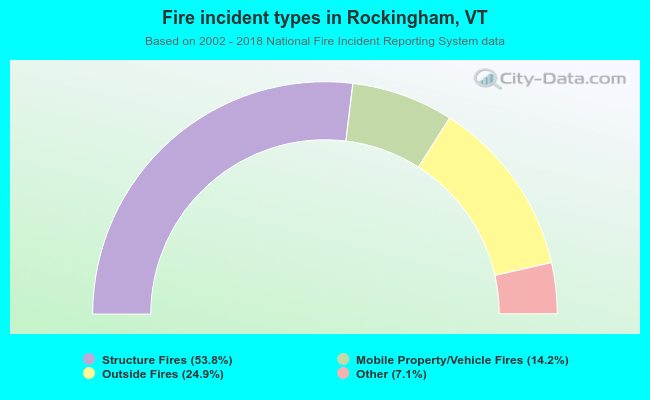 When looking into fire subcategories, the most reports belonged to: Structure Fires (53.8%), and Outside Fires (24.9%).