Salem: Fire Incidents, Illinois (IL)
Where are fire incidents reported in Salem, IL
Something went wrong! Please refresh the page.
|
| |||||||||||||||||||||||||||||||||||||||||||||||||||||||||||||||||||||||||||||||||||||||||||||||||||||||||||||
2005 - 2018 National Fire Incident Reporting System (NFIRS) incidents
- Incident types reported to NFIRS in Salem, IL
- 94155.6%Fire
- 26615.7%Good Intent Call
- 1569.2%Hazardous Condition
- 1317.7%Rescue & EMS
- 1297.6%False Alarm
- 482.8%Service Call
- 201.2%Severe Weather
- Fire incident types reported to NFIRS in Salem, IL
- 43346.0%Structure Fires
- 32834.9%Outside Fires
- 14615.5%Mobile Property/Vehicle Fires
- 343.6%Other
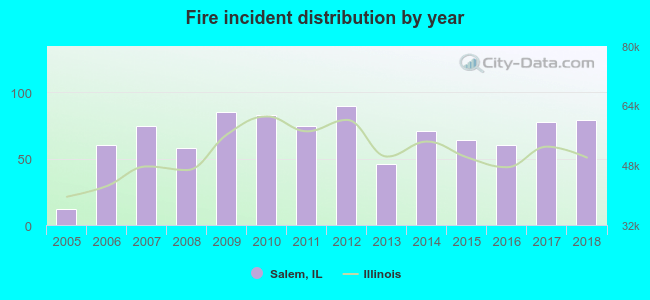 According to the data from the years 2005 - 2018 the average number of fire incidents per year is 67. The highest number of fires - 90 took place in 2012, and the least - 12 in 2005. The data has a growing trend.
The average number of yearly fire incidents per 10k residents in Salem, IL compared to nearest cities:
(Note: Based on data for the last 3 years, including only cities with population 5,000 and above)
| Salem: | 98.6 |
| Centralia: | 68.8 |
| Mount Vernon: | 16.0 |
| Vandalia: | 39.6 |
| Greenville: | 63.4 |
| Fairfield: | 74.8 |
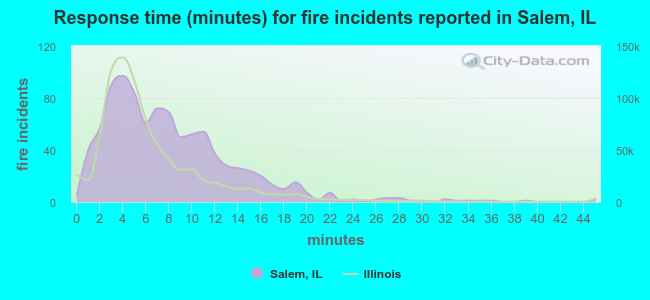 The median response time based on all reported fire incidents is 7 minutes. This is higher than the Illinois median value.
The median response time in Salem, IL compared to nearest cities:
(Note: Based on data for all years, including only cities with at least 500 fire incidents)
| Salem: | 7 minutes |
| Sandoval: | 5 minutes |
| Centralia: | 4 minutes |
| Mount Vernon: | 4 minutes |
| Carlyle: | 7 minutes |
| Vandalia: | 8 minutes |
| Nashville: | 10 minutes |
| Greenville: | 7 minutes |
| Fairfield: | 6 minutes |
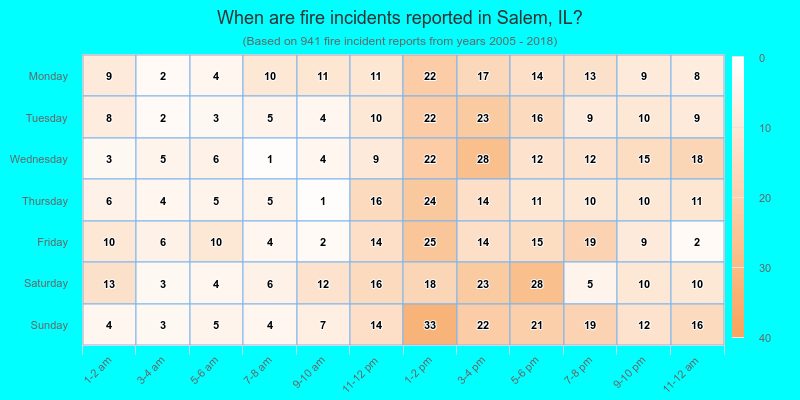
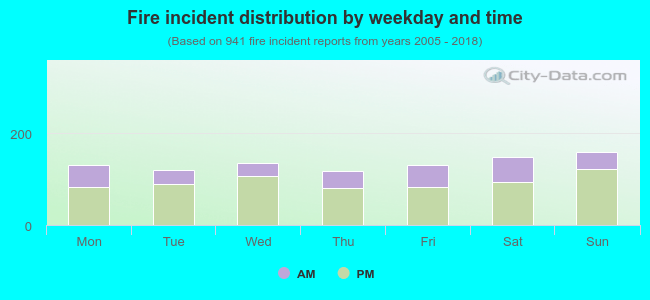 29.9% incidents where reported in the morning and 70.1% in the evening. The most fires (17.0%) took place on Sunday, and the least (12.4%) on Thursday.
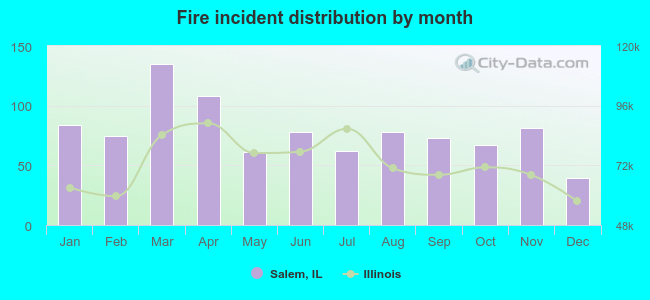 According to the 941 fires from years 2005 - 2018 most fires (14.3%) took place during March, and the least (4.1%) in December.
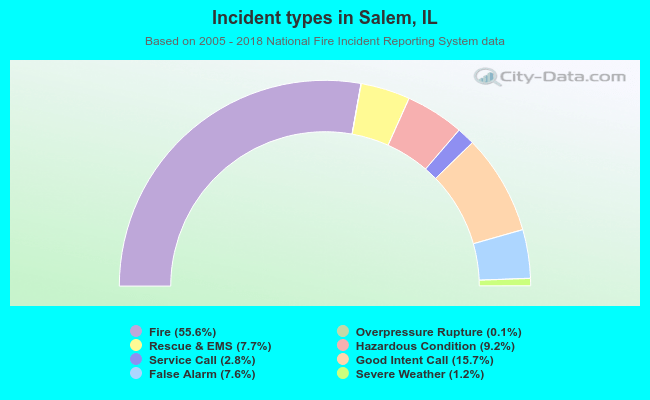 Out of all 1,692 cases reported during the years 2005 - 2018, the most belonged to the categories: Fire (55.6%), Good Intent Call (15.7%), and Hazardous Condition (9.2%).
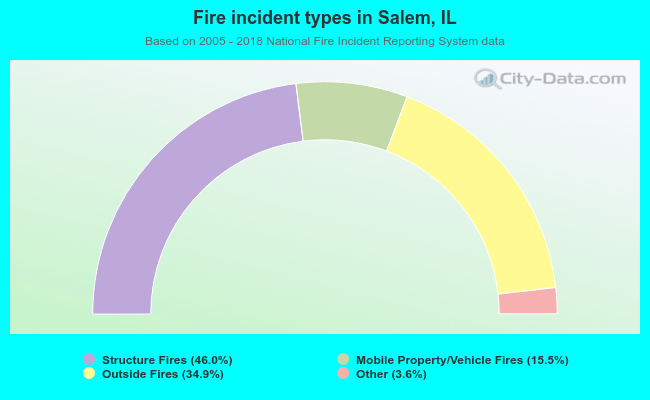 When looking into fire subcategories, the most incidents belonged to: Structure Fires (46.0%), and Outside Fires (34.9%).