San Bernardino: Fire Incidents, California (CA)
Where are fire incidents reported in San Bernardino, CA
Something went wrong! Please refresh the page.
|
| |||||||||||||||||||||||||||||||||||||||||||||||||||||||||||||||||||||||||||||||||||||||||||||||||||||||||||||
| Other | 553 | |||||||||||||||||||||||||||||||||||||||||||||||||||||||||||||||||||||||||||||||||||||||||||||||||||||||||||||
2005 - 2018 National Fire Incident Reporting System (NFIRS) incidents
- Incident types reported to NFIRS in San Bernardino, CA
- 40,08873.8%Rescue & EMS
- 9,23717.0%Good Intent Call
- 1,7623.2%Service Call
- 1,6413.0%Fire
- 1,0281.9%False Alarm
- 4940.9%Hazardous Condition
- Fire incident types reported to NFIRS in San Bernardino, CA
- 85952.3%Outside Fires
- 47528.9%Structure Fires
- 22713.8%Mobile Property/Vehicle Fires
- 804.9%Other
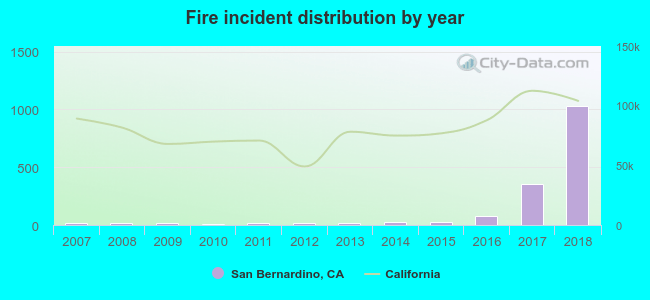 According to the data from the years 2005 - 2018 the average number of fire incidents per year is 135. The highest number of reported fires - 1,032 took place in 2018, and the least - 5 in 2010. The data has an increasing trend.
The average number of yearly fire incidents per 10k residents in San Bernardino, CA compared to nearest cities:
(Note: Based on data for the last 3 years, including only cities with population 5,000 and above)
| San Bernardino: | 22.7 |
| Muscoy: | 21.0 |
| Colton: | 60.0 |
| Highland: | 2.4 |
| Rialto: | 4.3 |
| Loma Linda: | 30.9 |
| Grand Terrace: | 8.3 |
| Bloomington: | 11.2 |
| Crestline: | 13.3 |
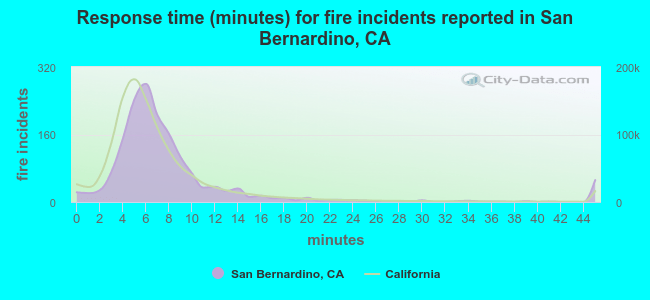 The median response time based on all reported fire incidents is 7 minutes. This is about the same as the California median value.
The median response time in San Bernardino, CA compared to nearest cities:
(Note: Based on data for all years, including only cities with at least 500 fire incidents)
| San Bernardino: | 7 minutes |
| Colton: | 7 minutes |
| Rialto: | 8 minutes |
| Loma Linda: | 6 minutes |
| Redlands: | 6 minutes |
| Fontana: | 7 minutes |
| Riverside: | 6 minutes |
| Rancho Cucamonga: | 7 minutes |
| Hesperia: | 8 minutes |
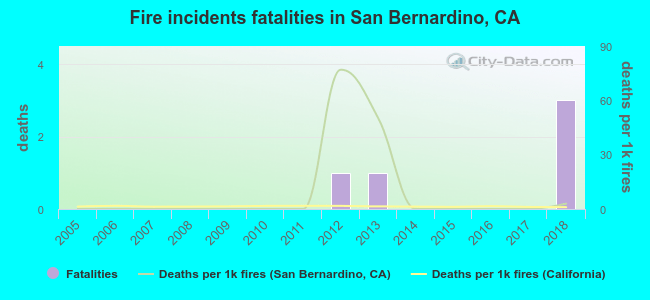 According to the reports from the years 2005 - 2018 the average number of fire-related fatalities per year is 0. The highest number of deaths - 3 took place in 2018, and the lowest - 0 in 2005. The data has a growing trend.
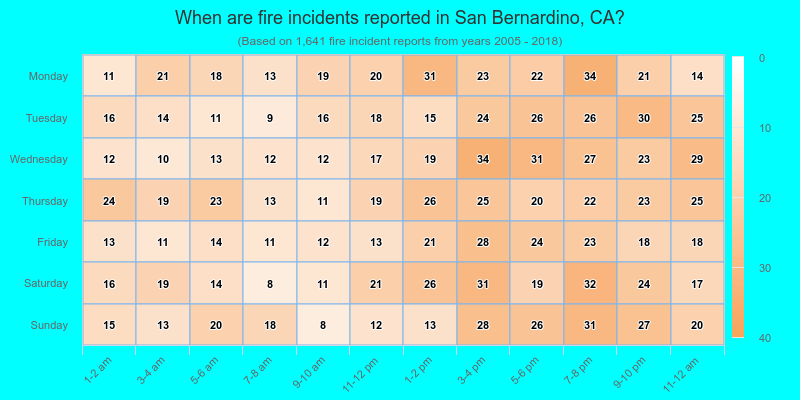
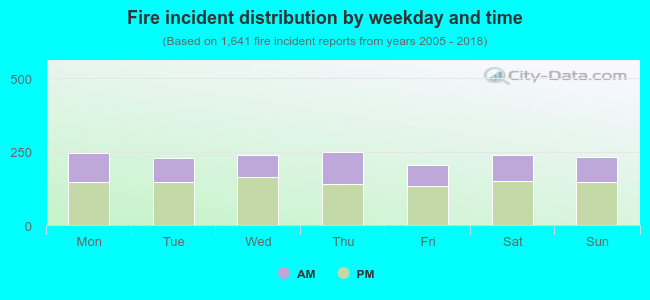 37.8% incidents where reported in the morning and 62.2% in the evening. The most fires (15.2%) took place on Thursday, and the least (12.6%) on Friday.
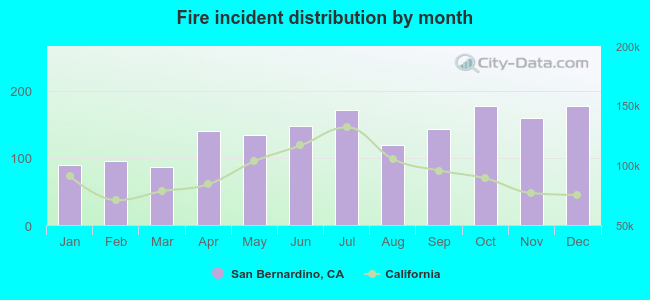 Based on the 1,641 fire incident reports from years 2005 - 2018 most fires (10.8%) took place during October, and the least (5.2%) in March.
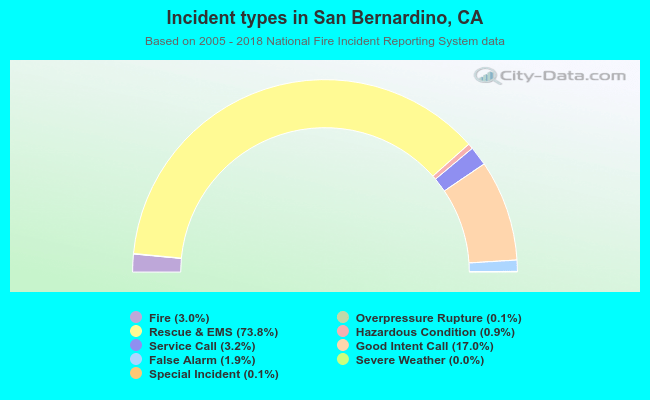 Out of all 54,321 cases reported during the years 2005 - 2018, the most belonged to the categories: Rescue & EMS (73.8%), Good Intent Call (17.0%), and Service Call (3.2%).
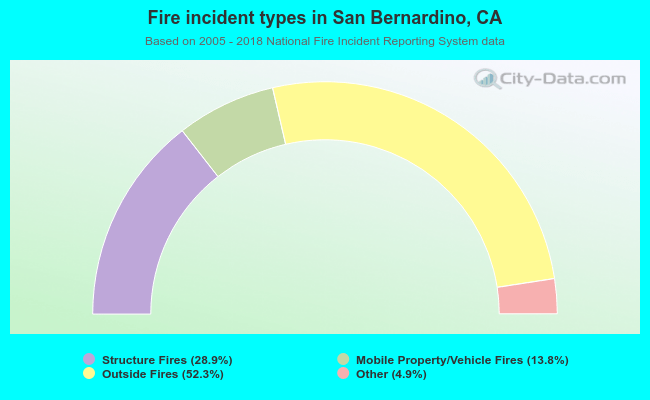 When looking into fire subcategories, the most reports belonged to: Outside Fires (52.3%), and Structure Fires (28.9%).