Savannah: Fire Incidents, Georgia (GA)
Where are fire incidents reported in Savannah, GA
Something went wrong! Please refresh the page.
| Fire incidents reported | |
|---|---|
| Sreet name | Count |
| ABERCORN ST | 1,294 |
| OGEECHEE RD | 786 |
| WATERS AVE | 450 |
| VICTORY DR | 404 |
| WHITE BLUFF RD | 326 |
| SKIDAWAY RD | 296 |
| MONTGOMERY ST | 286 |
| GWINNETT ST | 240 |
| 38TH ST | 232 |
| MIDDLEGROUND RD | 226 |
| 39TH ST | 218 |
| 37TH ST | 202 |
| BAY ST | 190 |
| PRESIDENT ST | 188 |
| BULL ST | 186 |
| ANDERSON ST | 180 |
| 54TH ST | 178 |
| QUACCO RD | 176 |
| BARNARD ST | 158 |
| 36TH ST | 152 |
| DERENNE AVE | 152 |
| GARRARD AVE | 150 |
| PARK AVE | 146 |
| HAMPSTEAD AVE | 144 |
| 40TH ST | 140 |
| FERGUSON AVE | 136 |
| EISENHOWER DR | 134 |
| GROVE POINT RD | 134 |
| CHEVIS RD | 132 |
| MONTGOMERY XRDS | 132 |
| Other | 9,720 |
2002 - 2018 National Fire Incident Reporting System (NFIRS) incidents
- Incident types reported to NFIRS in Savannah, GA
- 17,48826.6%Fire
- 16,29124.8%Rescue & EMS
- 13,39220.4%False Alarm
- 9,80414.9%Hazardous Condition
- 4,7057.2%Service Call
- 3,7825.8%Good Intent Call
- 1130.2%Overpressure Rupture
- 950.1%Severe Weather
- Fire incident types reported to NFIRS in Savannah, GA
- 7,64043.7%Outside Fires
- 6,16835.3%Structure Fires
- 3,16918.1%Mobile Property/Vehicle Fires
- 5112.9%Other
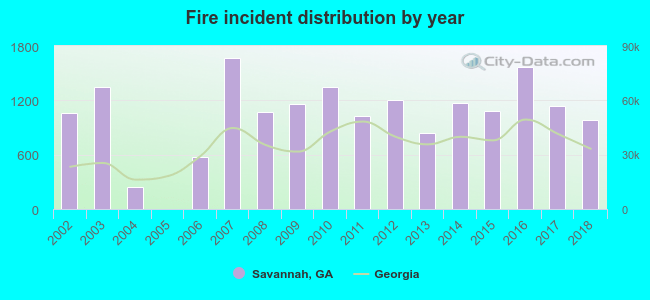 According to the data from the years 2002 - 2018 the average number of fire incidents per year is 1,029. The highest number of reported fires - 1,673 took place in 2007, and the least - 0 in 2005. The data has a declining trend.
The average number of yearly fire incidents per 10k residents in Savannah, GA compared to nearest cities:
(Note: Based on data for the last 3 years, including only cities with population 5,000 and above)
| Savannah: | 85.0 |
| Garden City: | 134.9 |
| Wilmington Island: | 0.7 |
| Georgetown: | 6.2 |
| Port Wentworth: | 85.2 |
| Skidaway Island: | 4.8 |
| Pooler: | 60.2 |
| Richmond Hill: | 89.6 |
| Rincon: | 63.6 |
 The median response time based on all reported fire incidents is 4 minutes. This is lower than the state median value.
The median response time in Savannah, GA compared to nearest cities:
(Note: Based on data for all years, including only cities with at least 500 fire incidents)
| Savannah: | 4 minutes |
| Garden City: | 5 minutes |
| Port Wentworth: | 5 minutes |
| Pooler: | 6 minutes |
| Bloomingdale: | 6 minutes |
| Richmond Hill: | 6 minutes |
| Rincon: | 6 minutes |
| Springfield: | 7 minutes |
| Midway: | 10 minutes |
 Based on the data from the years 2002 - 2018 the average number of fire-related yearly deaths is 3. The highest number of reported deaths - 8 took place in 2002, and the lowest - 0 in 2004. The data has a declining trend.
The average number of deaths per 1,000 fire incidents is 2. This indicator was the highest - 8 in 2002, and the lowest 0 in 2004. The trend for deaths per 1,000 fires is declining. Compared to the state value the number of fatalities per 1,000 incidents is higher.
Based on the data from the years 2002 - 2018 the average number of fire-related yearly deaths is 3. The highest number of reported deaths - 8 took place in 2002, and the lowest - 0 in 2004. The data has a declining trend.
The average number of deaths per 1,000 fire incidents is 2. This indicator was the highest - 8 in 2002, and the lowest 0 in 2004. The trend for deaths per 1,000 fires is declining. Compared to the state value the number of fatalities per 1,000 incidents is higher.Deaths per 1,000 incidents in Savannah, GA compared to nearest cities:
(Note: Based on data for all years, including only cities with at least 2,500 fire incidents)
| Savannah: | 2.6 |
| Statesboro: | 1.0 |
 Based on the data from the years 2002 - 2018 the average number of fire-related yearly casualties is 7. The highest number of reported injuries - 15 took place in 2003, and the lowest - 0 in 2005. The data has a growing trend.
The average number of casualties per 1,000 fires is 7. This indicator was the highest - 15 in 2018, and the lowest 0 in 2005. The trend for injuries per 1,000 incidents is increasing. Compared to the state value the number of casualties per 1,000 fire incidents is lower.
Based on the data from the years 2002 - 2018 the average number of fire-related yearly casualties is 7. The highest number of reported injuries - 15 took place in 2003, and the lowest - 0 in 2005. The data has a growing trend.
The average number of casualties per 1,000 fires is 7. This indicator was the highest - 15 in 2018, and the lowest 0 in 2005. The trend for injuries per 1,000 incidents is increasing. Compared to the state value the number of casualties per 1,000 fire incidents is lower.Casualties per 1,000 incidents in Savannah, GA compared to nearest cities:
(Note: Based on data for all years, including only cities with at least 500 fire incidents)
| Savannah: | 7.0 |
| Garden City: | 0.8 |
| Port Wentworth: | 1.7 |
| Pooler: | 20.8 |
| Bloomingdale: | 15.8 |
| Richmond Hill: | 4.5 |
| Rincon: | 5.9 |
| Springfield: | 3.5 |
| Midway: | 0.0 |
 30.6% incidents where reported in the morning and 69.4% in the evening. The most fires (15.7%) took place on Saturday, and the least (13.5%) on Wednesday.
 Based on the 17,488 incident reports from years 2002 - 2018 most fires (10.8%) took place during April, and the least (6.9%) in September.
 Out of all 65,733 cases reported during the years 2002 - 2018, the most belonged to the categories: Fire (26.6%), Rescue & EMS (24.8%), and False Alarm (20.4%).
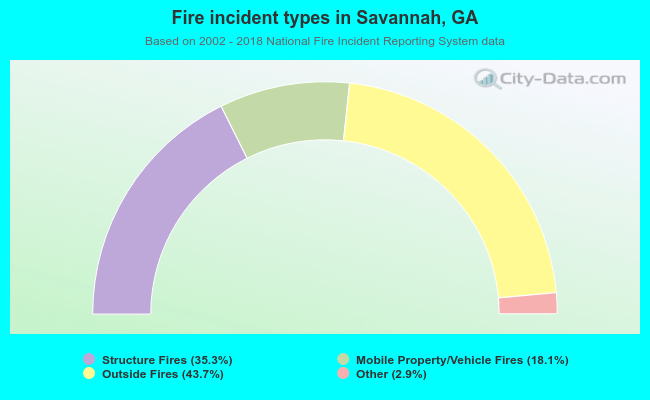 When looking into fire subcategories, the most reports belonged to: Outside Fires (43.7%), and Structure Fires (35.3%).