Science Hill: Fire Incidents, Kentucky (KY)
Where are fire incidents reported in Science Hill, KY
Something went wrong! Please refresh the page.
|
| |||||||||||||||||||||||||||||||||||||||||||||||||||||||||||||||||||||||||||||||||||||||||||||||||||||||||||||
| Other | 18 | |||||||||||||||||||||||||||||||||||||||||||||||||||||||||||||||||||||||||||||||||||||||||||||||||||||||||||||
2002 - 2018 National Fire Incident Reporting System (NFIRS) incidents
- Incident types reported to NFIRS in Science Hill, KY
- 56849.9%Fire
- 31627.8%Rescue & EMS
- 998.7%Good Intent Call
- 696.1%Hazardous Condition
- 564.9%Service Call
- 262.3%False Alarm
- 20.2%Severe Weather
- 20.2%Special Incident
- Fire incident types reported to NFIRS in Science Hill, KY
- 26446.5%Structure Fires
- 20836.6%Outside Fires
- 8414.8%Mobile Property/Vehicle Fires
- 122.1%Other
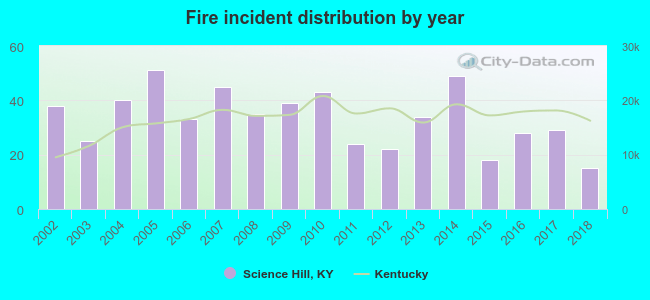 Based on the data from the years 2002 - 2018 the average number of fires per year is 33. The highest number of fires - 51 took place in 2005, and the least - 15 in 2018. The data has a declining trend.
 The median response time based on all reported fire incidents is 9 minutes. This is higher than the Kentucky median value.
The median response time in Science Hill, KY compared to nearest cities:
(Note: Based on data for all years, including only cities with at least 500 fire incidents)
| Science Hill: | 9 minutes |
| Somerset: | 7 minutes |
| Eubank: | 10 minutes |
| Liberty: | 9 minutes |
| Brodhead: | 9 minutes |
| Hustonville: | 12 minutes |
| Stanford: | 11 minutes |
| Russell Springs: | 8 minutes |
| Monticello: | 10 minutes |
 30.6% incidents where reported in the morning and 69.4% in the evening. The most fires (16.0%) took place on Friday, and the least (12.7%) on Monday.
 Based on the 568 fire incident reports from years 2002 - 2018 most fires (13.0%) took place during February, and the least (3.9%) in May.
 Out of all 1,138 cases reported during the years 2002 - 2018, the most belonged to the categories: Fire (49.9%), Overpressure Rupture (27.8%), and Service Call (8.7%).
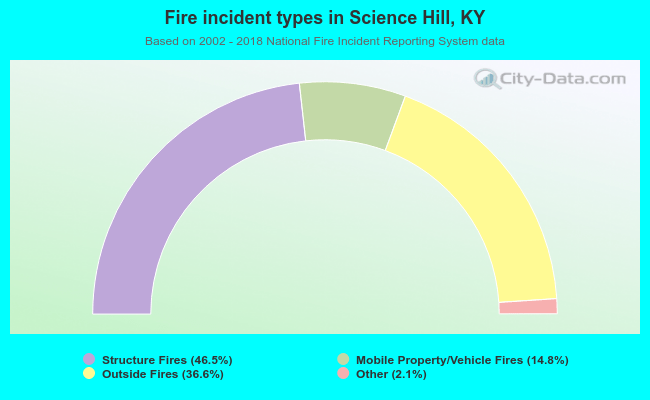 When looking into fire subcategories, the most incidents belonged to: Structure Fires (46.5%), and Outside Fires (36.6%).