Seneca: Fire Incidents, Illinois (IL)
Where are fire incidents reported in Seneca, IL
Something went wrong! Please refresh the page.
|
| |||||||||||||||||||||||||||||||||||||||||||||||||||||||||||||||||||||||||||||||||||||||||||||||||||||||||||||
2003 - 2018 National Fire Incident Reporting System (NFIRS) incidents
- Incident types reported to NFIRS in Seneca, IL
- 48545.2%Fire
- 20519.1%Hazardous Condition
- 17616.4%Rescue & EMS
- 1009.3%Good Intent Call
- 524.8%False Alarm
- 494.6%Service Call
- 40.4%Severe Weather
- 30.3%Special Incident
- Fire incident types reported to NFIRS in Seneca, IL
- 20041.2%Structure Fires
- 18037.1%Outside Fires
- 8918.4%Mobile Property/Vehicle Fires
- 163.3%Other
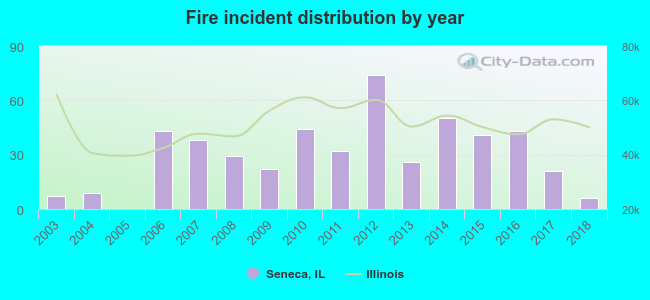 Based on the data from the years 2003 - 2018 the average number of fires per year is 30. The highest number of reported fires - 74 took place in 2012, and the least - 0 in 2005. The data has a declining trend.
 According to the data from the years 2003 - 2018 the average number of fire-related yearly casualties is 0. The highest number of reported casualties - 2 took place in 2006, and the lowest - 0 in 2003. The data has a constant trend.
 33.8% incidents where reported in the morning and 66.2% in the evening. The most fires (17.5%) took place on Saturday, and the least (10.1%) on Wednesday.
 According to the 485 reports from years 2003 - 2018 most fires (11.8%) took place during April, and the least (5.8%) in February.
 Out of all 1,074 cases reported during the years 2003 - 2018, the most belonged to the categories: Fire (45.2%), Rescue & EMS (19.1%), and Overpressure Rupture (16.4%).
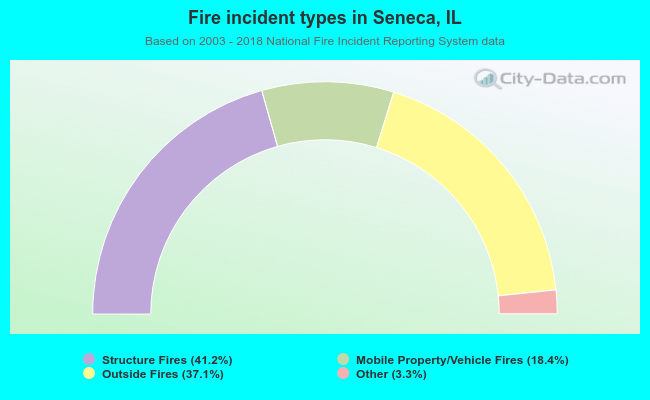 When looking into fire subcategories, the most incidents belonged to: Structure Fires (41.2%), and Outside Fires (37.1%).