Sharon: Fire Incidents, Pennsylvania (PA)
Where are fire incidents reported in Sharon, PA
Something went wrong! Please refresh the page.
| Fire incidents reported | |
|---|---|
| Sreet name | Count |
| IRVINE AV | 70 |
| STATE ST | 70 |
| OAKLAND AV | 54 |
| NEW CASTLE AV | 44 |
| CONNELLY BLVD | 40 |
| CEDAR AV | 36 |
| SHERMAN AV | 36 |
| BALDWIN AV | 30 |
| SHARPSVILLE AV | 28 |
| STAMBAUGH AV | 26 |
| DOCK ST | 24 |
| MESABI ST | 20 |
| STATE ST | 20 |
| BUDD ST | 18 |
| ORCHARD ST | 18 |
| COLUMBIA ST | 16 |
| ELM AV | 16 |
| HULL ST | 16 |
| LOGAN AV | 16 |
| LOGAN AVE | 16 |
| MALLEABLE ST | 16 |
| PRINDLE ST | 16 |
| SHERMAN AVE | 16 |
| SPRUCE AV | 16 |
| STATE LINE RD | 16 |
| STERLING AV | 16 |
| A ST | 14 |
| ALDERMAN AV | 14 |
| DIVISION ST | 14 |
| GRANT ST | 14 |
| Other | 77 |
2002 - 2018 National Fire Incident Reporting System (NFIRS) incidents
- Incident types reported to NFIRS in Sharon, PA
- 84328.6%Fire
- 69323.5%Service Call
- 66022.4%Hazardous Condition
- 2077.0%Special Incident
- 2036.9%False Alarm
- 1745.9%Good Intent Call
- 1153.9%Rescue & EMS
- 441.5%Severe Weather
- 60.2%Overpressure Rupture
- Fire incident types reported to NFIRS in Sharon, PA
- 42650.5%Structure Fires
- 27933.1%Outside Fires
- 839.8%Other
- 556.5%Mobile Property/Vehicle Fires
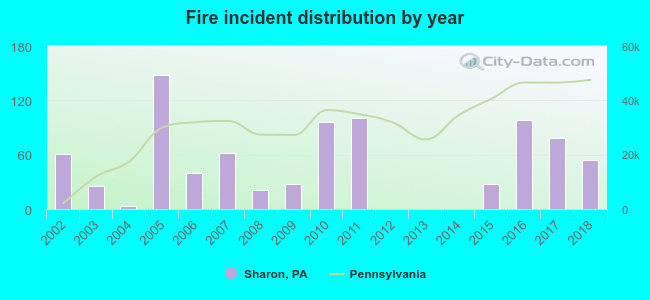 According to the data from the years 2002 - 2018 the average number of fires per year is 50. The highest number of fire incidents - 148 took place in 2005, and the least - 0 in 2012. The data has a decreasing trend.
The average number of yearly fire incidents per 10k residents in Sharon, PA compared to nearest cities:
(Note: Based on data for the last 3 years, including only cities with population 5,000 and above)
| Sharon: | 56.1 |
| Hermitage: | 27.9 |
| Greenville: | 134.0 |
| New Castle: | 47.7 |
| Grove City: | 32.1 |
 The median response time based on all reported fire incidents is 4 minutes. This is lower compared to the state median value.
The median response time in Sharon, PA compared to nearest cities:
(Note: Based on data for all years, including only cities with at least 500 fire incidents)
| Sharon: | 4 minutes |
| Hubbard: | 8 minutes |
| Girard: | 4 minutes |
| Campbell: | 3 minutes |
| Youngstown: | 3 minutes |
| Struthers: | 3 minutes |
| Greenville: | 6 minutes |
| Cortland: | 8 minutes |
| Niles: | 4 minutes |
 36.5% incidents where reported in the morning and 63.5% in the evening. The most fires (16.8%) took place on Sunday, and the least (12.6%) on Monday.
 According to the 843 reports from years 2002 - 2018 most fires (13.9%) took place during June, and the least (4.5%) in March.
 Out of all 2,945 cases reported during the years 2002 - 2018, the most belonged to the categories: Fire (28.6%), Service Call (23.5%), and Hazardous Condition (22.4%).
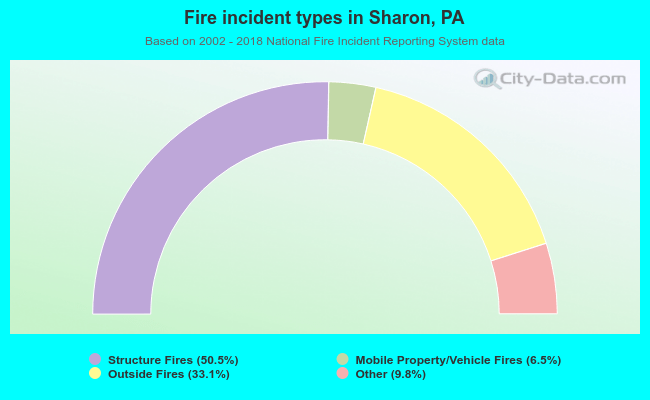 When looking into fire subcategories, the most incidents belonged to: Structure Fires (50.5%), and Outside Fires (33.1%).