Shelby: Fire Incidents, Mississippi (MS)
Where are fire incidents reported in Shelby, MS
Something went wrong! Please refresh the page.
|
| |||||||||||||||||||||||||||||||||||||||||||||||||||||||||||||||||||||||||||||||||||||||||||||||||||||||||||||
2003 - 2018 National Fire Incident Reporting System (NFIRS) incidents
- Incident types reported to NFIRS in Shelby, MS
- 58376.1%Fire
- 11414.9%Hazardous Condition
- 354.6%Rescue & EMS
- 131.7%Good Intent Call
- 131.7%False Alarm
- 70.9%Service Call
- 10.1%Overpressure Rupture
- Fire incident types reported to NFIRS in Shelby, MS
- 20134.5%Structure Fires
- 16227.8%Outside Fires
- 14124.2%Other
- 7913.6%Mobile Property/Vehicle Fires
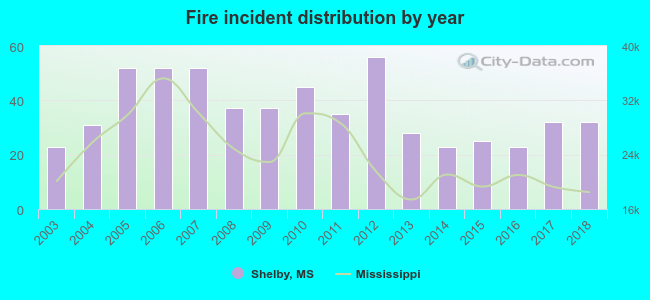 Based on the data from the years 2003 - 2018 the average number of fires per year is 36. The highest number of reported fire incidents - 56 took place in 2012, and the least - 23 in 2003. The data has an increasing trend.
 The median response time based on all reported fire incidents is 7 minutes. This is similar to the state median value.
The median response time in Shelby, MS compared to nearest cities:
(Note: Based on data for all years, including only cities with at least 500 fire incidents)
| Shelby: | 7 minutes |
| Cleveland: | 3 minutes |
| Clarksdale: | 4 minutes |
| Lambert: | 9 minutes |
| Marks: | 9 minutes |
| Indianola: | 4 minutes |
| Leland: | 3 minutes |
| Helena: | 3 minutes |
| Charleston: | 9 minutes |
 41.0% incidents where reported in the morning and 59.0% in the evening. The most fires (16.6%) took place on Saturday, and the least (12.5%) on Friday.
 Based on the 583 fire incidents from years 2003 - 2018 most fires (11.7%) took place during September, and the least (5.7%) in February.
 Out of all 766 cases reported during the years 2003 - 2018, the most belonged to the categories: Fire (76.1%), Hazardous Condition (14.9%), and Rescue & EMS (4.6%).
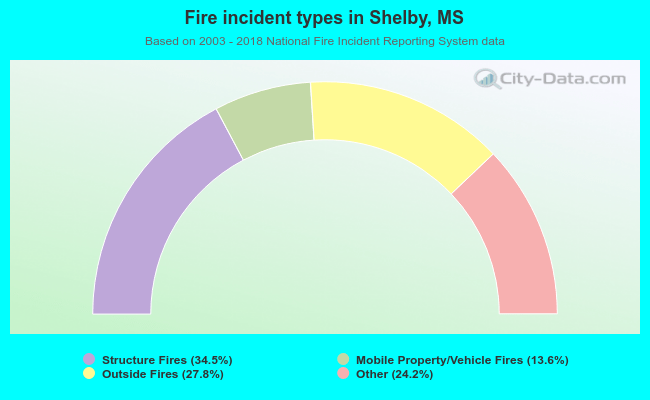 When looking into fire subcategories, the most incidents belonged to: Structure Fires (34.5%), and Outside Fires (27.8%).