Shelbyville: Fire Incidents, Kentucky (KY)
Where are fire incidents reported in Shelbyville, KY
Something went wrong! Please refresh the page.
| Fire incidents reported | |
|---|---|
| Sreet name | Count |
| MIDLAND TRL | 132 |
| TAYLORSVILLE RD | 128 |
| FRANKFORT RD | 122 |
| EMINENCE PIKE | 74 |
| INTERSTATE 64 FWY | 60 |
| MT EDEN RD | 54 |
| MIDLAND BLVD | 52 |
| MIDLAND INDUSTRIAL DR | 52 |
| BOONE STATION RD | 50 |
| WASHINGTON ST | 50 |
| BURKS BRANCH RD | 48 |
| MAIN ST | 48 |
| CROPPER RD | 46 |
| BENSON RD | 44 |
| INTERSTATE 64 | 44 |
| LA GRANGE RD | 42 |
| MOUNT EDEN RD | 42 |
| OLD BRUNERSTOWN RD | 42 |
| HENRY CLAY ST | 38 |
| OLD SEVEN MILE PIKE | 38 |
| HEMPRIDGE RD | 36 |
| ISAAC SHELBY DR | 36 |
| KENTUCKY ST | 34 |
| MT. EDEN RD | 34 |
| ZARING MILL RD | 32 |
| BOONE STA | 30 |
| INTERSTATE - 64 FWY | 30 |
| CLIFTON CT | 26 |
| BAKER DR | 24 |
| HOOPER STATION RD | 24 |
| Other | 520 |
2002 - 2018 National Fire Incident Reporting System (NFIRS) incidents
- Incident types reported to NFIRS in Shelbyville, KY
- 3,94836.4%Rescue & EMS
- 2,03218.7%Fire
- 1,82416.8%Hazardous Condition
- 1,14610.6%Good Intent Call
- 9608.8%False Alarm
- 8217.6%Service Call
- 710.7%Special Incident
- 280.3%Overpressure Rupture
- 280.3%Severe Weather
- Fire incident types reported to NFIRS in Shelbyville, KY
- 82040.4%Structure Fires
- 65232.1%Outside Fires
- 42921.1%Mobile Property/Vehicle Fires
- 1316.4%Other
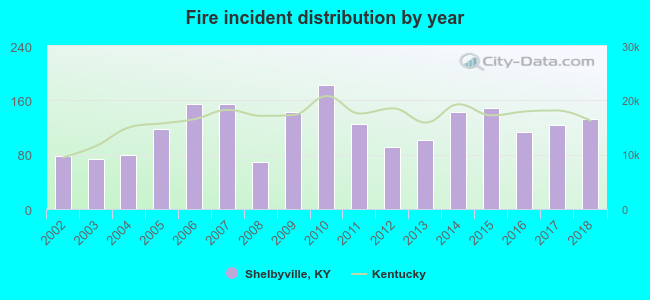 Based on the data from the years 2002 - 2018 the average number of fires per year is 120. The highest number of fires - 182 took place in 2010, and the least - 69 in 2008. The data has a rising trend.
The average number of yearly fire incidents per 10k residents in Shelbyville, KY compared to nearest cities:
(Note: Based on data for the last 3 years, including only cities with population 5,000 and above)
| Shelbyville: | 82.3 |
| Buckner: | 3.4 |
| Jeffersontown: | 23.4 |
| Frankfort: | 53.7 |
| Lyndon: | 0.9 |
| Fern Creek: | 25.6 |
| Lawrenceburg: | 40.6 |
 The median response time based on all reported fire incidents is 6 minutes. This is close to the Kentucky median value.
The median response time in Shelbyville, KY compared to nearest cities:
(Note: Based on data for all years, including only cities with at least 500 fire incidents)
| Shelbyville: | 6 minutes |
| Simpsonville: | 7 minutes |
| Crestwood: | 7 minutes |
| Jeffersontown: | 5 minutes |
| Frankfort: | 6 minutes |
| Fern Creek: | 5 minutes |
 Based on the data from the years 2002 - 2018 the average number of fire-related fatalities per year is 0. The highest number of reported deaths - 2 took place in 2003, and the lowest - 0 in 2002. The data has an increasing trend.
 Based on the data from the years 2002 - 2018 the average number of fire-related casualties per year is 2. The highest number of reported casualties - 6 took place in 2007, and the lowest - 0 in 2002. The data has a rising trend.
The average number of injuries per 1,000 fires is 15. This indicator was the highest - 39 in 2013, and the lowest 0 in 2002. The trend for injuries per 1,000 incidents is growing. Compared to the Kentucky value the number of casualties per 1,000 fire incidents is much higher.
Based on the data from the years 2002 - 2018 the average number of fire-related casualties per year is 2. The highest number of reported casualties - 6 took place in 2007, and the lowest - 0 in 2002. The data has a rising trend.
The average number of injuries per 1,000 fires is 15. This indicator was the highest - 39 in 2013, and the lowest 0 in 2002. The trend for injuries per 1,000 incidents is growing. Compared to the Kentucky value the number of casualties per 1,000 fire incidents is much higher.Casualties per 1,000 incidents in Shelbyville, KY compared to nearest cities:
(Note: Based on data for all years, including only cities with at least 500 fire incidents)
| Shelbyville: | 15.3 |
| Simpsonville: | 0.0 |
| Crestwood: | 2.1 |
| Jeffersontown: | 9.3 |
| Frankfort: | 12.5 |
| Fern Creek: | 1.7 |
 28.3% incidents where reported in the morning and 71.7% in the evening. The most fires (15.5%) took place on Monday, and the least (12.8%) on Saturday.
 According to the 2,032 fire incidents from years 2002 - 2018 most fires (9.4%) took place during August, and the least (7.0%) in November.
 Out of all 10,858 cases reported during the years 2002 - 2018, the most belonged to the categories: Rescue & EMS (36.4%), Fire (18.7%), and Hazardous Condition (16.8%).
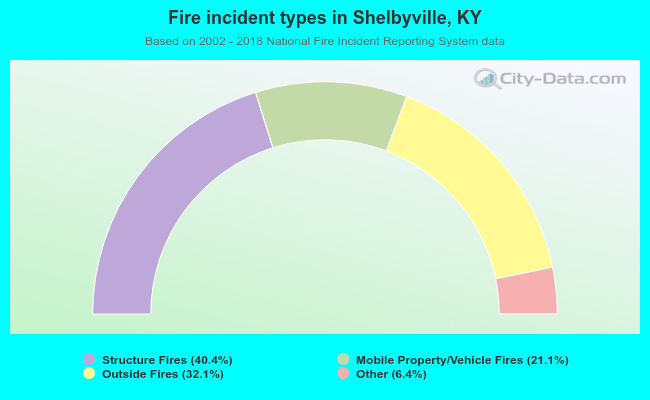 When looking into fire subcategories, the most reports belonged to: Structure Fires (40.4%), and Outside Fires (32.1%).