| Fire incidents reported |
|---|
| Sreet name | Count |
|---|
| 1002 LAKEVIEW LN | 6 | | 8414 CR 132 | 6 | | FM 1361 | 6 | | FM50 SOUTH | 6 | | 10180 PARK ROAD 57 | 4 | | 1651 CO RD 278 | 4 | | 3615 FM 60E | 4 | | 850 OAK PLACE | 4 | | CR 132 | 4 | | CR 162 | 4 | | HWY 36 | 4 | | #17 GIEBEL LANE | 2 | | 10465 CR 408 | 2 | | 106 HICKORY TRAIL | 2 | | 10TH STREET @ 513 | 2 | | 11356 FM 3058 | 2 | | 11800 FM 60 E | 2 | | 11TH ST | 2 | | 12747 CR 274 | 2 | | 1278 CR 278 | 2 | | 1285 CR 278 | 2 | | 12TH STREET @ 408 | 2 | | 13349 CR 230 | 2 | | 13365 COUNTY ROAD 408 | 2 | | 13366 CR 133 | 2 |
| | | Fire incidents reported |
|---|
| Sreet name | Count |
|---|
| 1371 BIG BERRY | 2 | | 13855 FM 2155 | 2 | | 14222 PARK ROAD 57 | 2 | | 1437 BIG BERRY ROAD | 2 | | 14391 PRIVATE ROAD 4007 | 2 | | 14770 CR270 | 2 | | 14799 COUNTY ROAD | 2 | | 14908 CR 443 | 2 | | 15461 CR 237 | 2 | | 1621 CR 278 | 2 | | 16415 PR 4004 | 2 | | 1651 CO. RD. 278 | 2 | | 16541 CR 237 | 2 | | 16980 CR 424 | 2 | | 1735 BIG BERRY | 2 | | 180 ROSA LEE LANE | 2 | | 18135 HWY 36 SOUTH | 2 | | 1847 FM 60 EAST | 2 | | 1935 CO ROAD 418 | 2 | | 202 E LOIS LANE | 2 | | 203 BIRCH LN | 2 | | 204 KAYE ST | 2 | | 206 DRYWOOD | 2 | | 206 GIEBEL LANE | 2 | | |
|
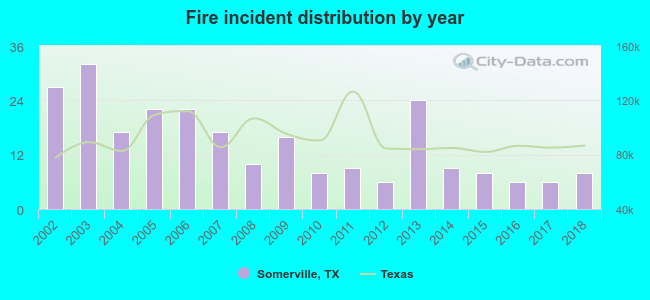 According to the data from the years 2002 - 2018 the average number of fires per year is 15. The highest number of fire incidents - 32 took place in 2003, and the least - 6 in 2012. The data has a decreasing trend.
 24.7% incidents where reported in the morning and 75.3% in the evening. The most fires (21.5%) took place on Saturday, and the least (10.5%) on Wednesday.
 According to the 247 fires from years 2002 - 2018 most fires (13.0%) took place during January, and the least (4.0%) in December.
 Out of all 383 cases reported during the years 2002 - 2018, the most belonged to the categories: Fire (64.5%), Rescue & EMS (17.0%), and Hazardous Condition (9.1%).
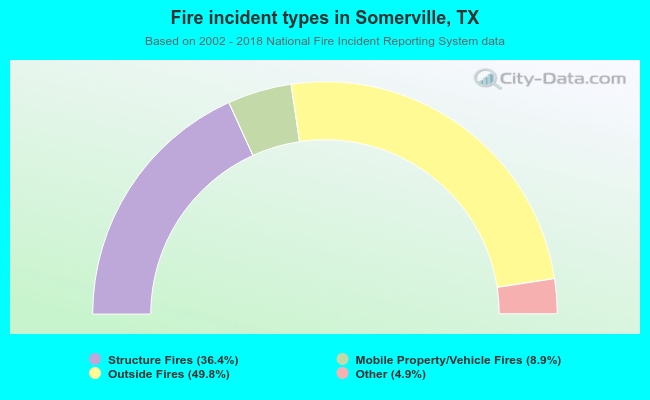 When looking into fire subcategories, the most reports belonged to: Outside Fires (49.8%), and Structure Fires (36.4%).