Southaven: Fire Incidents, Mississippi (MS)
Where are fire incidents reported in Southaven, MS
Something went wrong! Please refresh the page.
| Fire incidents reported | |
|---|---|
| Sreet name | Count |
| INTERSTATE 55 | 228 |
| GOODMAN RD | 202 |
| STATELINE RD | 200 |
| AIRWAYS BLVD | 114 |
| HWY 51 | 114 |
| CHURCH RD | 74 |
| RASCO RD | 52 |
| I-55 | 50 |
| SOUTHCREST PKY | 50 |
| GETWELL RD | 48 |
| GOODMAN | 48 |
| STATELINE | 34 |
| SWINNEA RD | 32 |
| AIRWAYS | 28 |
| HIGHWAY 51 | 24 |
| STARLANDING RD | 24 |
| WE ROSS PKY | 24 |
| CHESTERFIELD DR | 22 |
| COLONIAL HILLS DR | 22 |
| NAIL RD | 22 |
| SOUTH PARK CIR | 22 |
| TCHULAHOMA RD | 22 |
| SOUTHAVEN CIR | 20 |
| DORSHIRE RD | 18 |
| GOODMAN ROAD | 18 |
| GREENBROOK PKY | 18 |
| HAMILTON RD | 18 |
| LAKESHORE DR | 18 |
| NORTH CREEK BLVD | 18 |
| SWINNEA | 18 |
| Other | 957 |
2003 - 2018 National Fire Incident Reporting System (NFIRS) incidents
- Incident types reported to NFIRS in Southaven, MS
- 8,72553.4%Rescue & EMS
- 2,55915.7%Fire
- 1,97812.1%False Alarm
- 1,5309.4%Hazardous Condition
- 1,1226.9%Service Call
- 3332.0%Good Intent Call
- 400.2%Overpressure Rupture
- 240.1%Special Incident
- 180.1%Severe Weather
- Fire incident types reported to NFIRS in Southaven, MS
- 1,10243.1%Outside Fires
- 74629.2%Structure Fires
- 55821.8%Mobile Property/Vehicle Fires
- 1536.0%Other
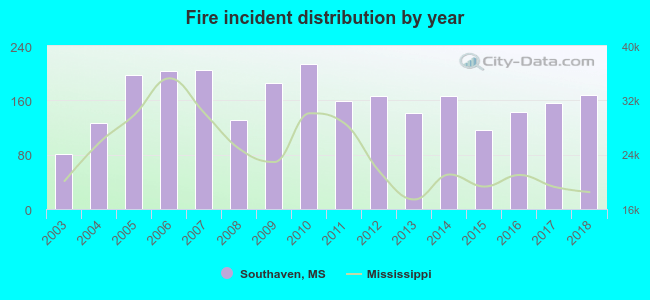 According to the data from the years 2003 - 2018 the average number of fires per year is 160. The highest number of fire incidents - 214 took place in 2010, and the least - 81 in 2003. The data has an increasing trend.
The average number of yearly fire incidents per 10k residents in Southaven, MS compared to nearest cities:
(Note: Based on data for the last 3 years, including only cities with population 5,000 and above)
| Southaven: | 30.0 |
| Horn Lake: | 37.9 |
| Olive Branch: | 52.0 |
| Hernando: | 104.2 |
| Senatobia: | 158.1 |
| Holly Springs: | 220.9 |
| Batesville: | 247.3 |
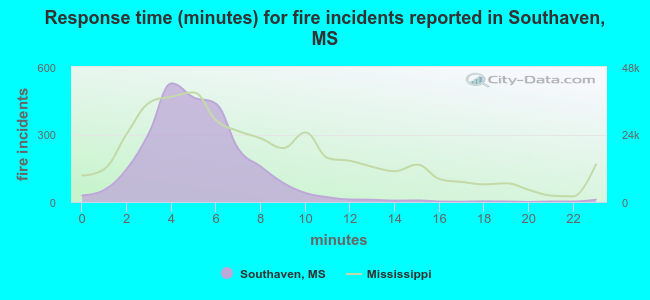 The median response time based on all reported fire incidents is 5 minutes. This is lower than the Mississippi median value.
The median response time in Southaven, MS compared to nearest cities:
(Note: Based on data for all years, including only cities with at least 500 fire incidents)
| Southaven: | 5 minutes |
| Horn Lake: | 4 minutes |
| Olive Branch: | 6 minutes |
| Walls: | 8 minutes |
| Hernando: | 8 minutes |
| West Memphis: | 5 minutes |
| Byhalia: | 12 minutes |
| Coldwater: | 10 minutes |
| Marion: | 7 minutes |
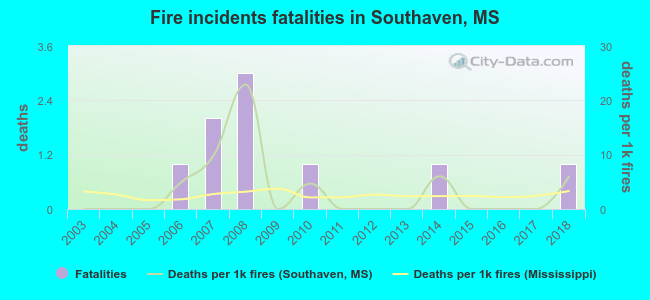 According to the reports from the years 2003 - 2018 the average number of fire-related fatalities per year is 1. The highest number of deaths - 3 took place in 2008, and the lowest - 0 in 2003. The data has a growing trend.
The average number of fatalities per 1,000 fire incidents is 3. This indicator was the highest - 23 in 2008, and the lowest 0 in 2003. The trend for deaths per 1,000 fires is growing. Compared to the state value the number of fatalities per 1,000 incidents is higher.
According to the reports from the years 2003 - 2018 the average number of fire-related fatalities per year is 1. The highest number of deaths - 3 took place in 2008, and the lowest - 0 in 2003. The data has a growing trend.
The average number of fatalities per 1,000 fire incidents is 3. This indicator was the highest - 23 in 2008, and the lowest 0 in 2003. The trend for deaths per 1,000 fires is growing. Compared to the state value the number of fatalities per 1,000 incidents is higher.Deaths per 1,000 incidents in Southaven, MS compared to nearest cities:
(Note: Based on data for all years, including only cities with at least 2,500 fire incidents)
| Southaven: | 3.5 |
| Olive Branch: | 1.4 |
| Hernando: | 2.1 |
| West Memphis: | 2.6 |
| Byhalia: | 1.4 |
| Holly Springs: | 1.5 |
| Batesville: | 2.7 |
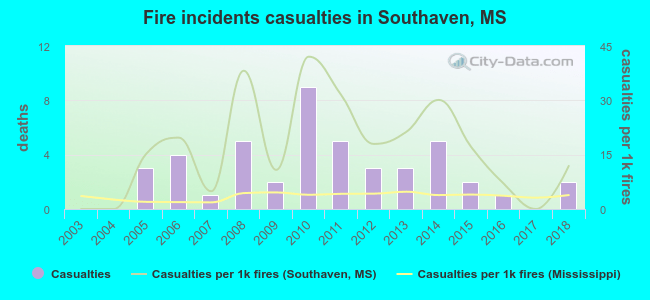 Based on the reports from the years 2003 - 2018 the average number of fire-related yearly casualties is 3. The highest number of reported casualties - 9 took place in 2010, and the lowest - 0 in 2003. The data has a rising trend.
The average number of casualties per 1,000 fires is 17. This indicator was the highest - 42 in 2010, and the lowest 0 in 2003. The trend for casualties per 1,000 fire incidents is increasing. Compared to the Mississippi value the number of injuries per 1,000 fire incidents is much higher.
Based on the reports from the years 2003 - 2018 the average number of fire-related yearly casualties is 3. The highest number of reported casualties - 9 took place in 2010, and the lowest - 0 in 2003. The data has a rising trend.
The average number of casualties per 1,000 fires is 17. This indicator was the highest - 42 in 2010, and the lowest 0 in 2003. The trend for casualties per 1,000 fire incidents is increasing. Compared to the Mississippi value the number of injuries per 1,000 fire incidents is much higher.Casualties per 1,000 incidents in Southaven, MS compared to nearest cities:
(Note: Based on data for all years, including only cities with at least 500 fire incidents)
| Southaven: | 17.6 |
| Horn Lake: | 21.5 |
| Olive Branch: | 2.8 |
| Walls: | 2.9 |
| Hernando: | 3.2 |
| West Memphis: | 8.2 |
| Byhalia: | 1.7 |
| Coldwater: | 5.1 |
| Marion: | 0.0 |
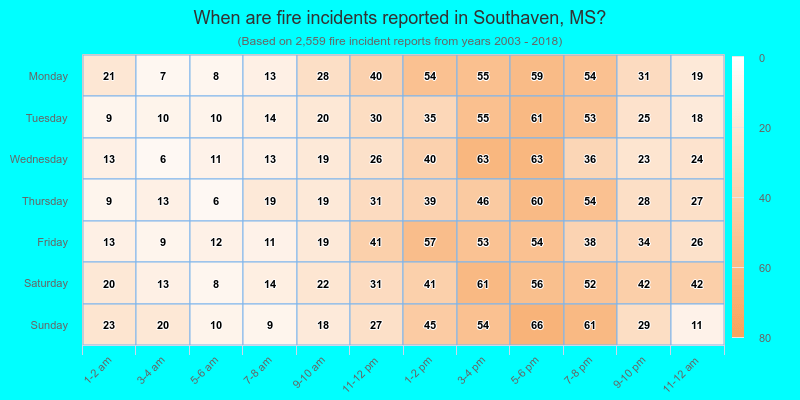
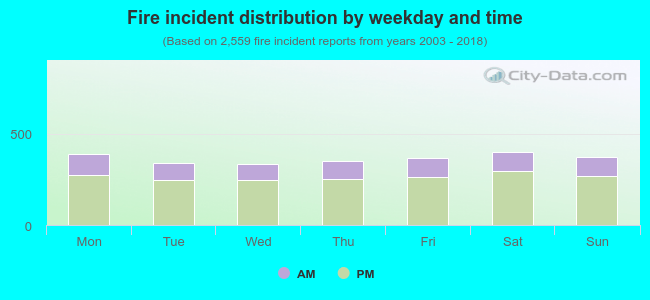 27.9% incidents where reported in the morning and 72.1% in the evening. The most fires (15.7%) took place on Saturday, and the least (13.2%) on Wednesday.
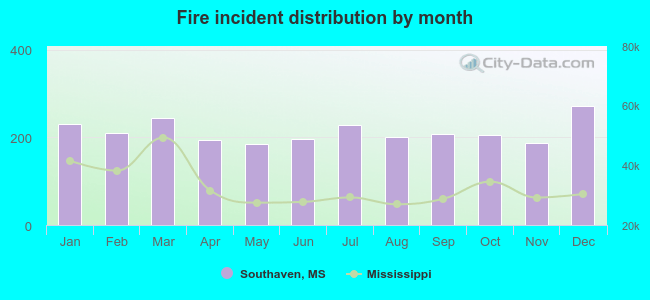 According to the 2,559 fire incidents from years 2003 - 2018 most fires (10.6%) took place during December, and the least (7.2%) in May.
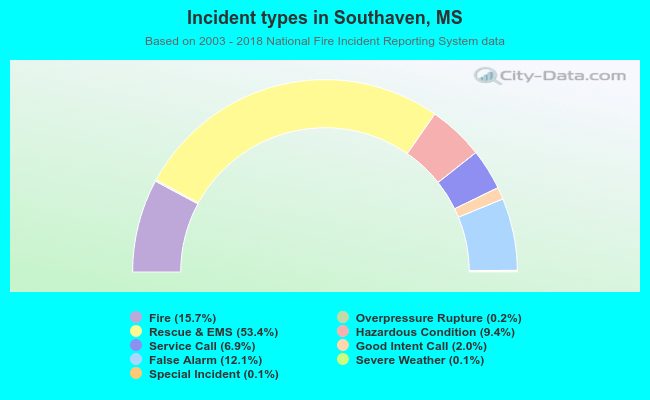 Out of all 16,329 cases reported during the years 2003 - 2018, the most belonged to the categories: Rescue & EMS (53.4%), Fire (15.7%), and False Alarm (12.1%).
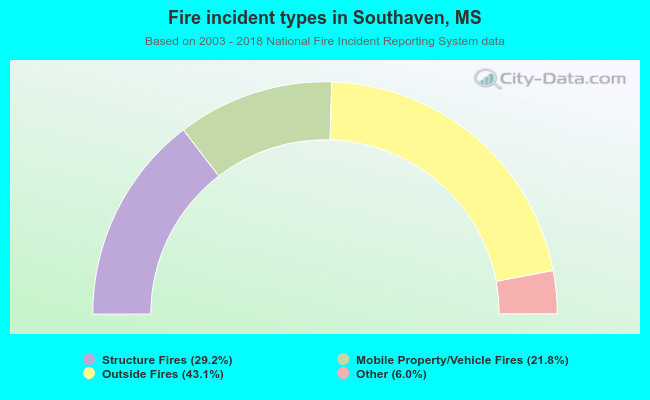 When looking into fire subcategories, the most reports belonged to: Outside Fires (43.1%), and Structure Fires (29.2%).