Springfield: Fire Incidents, Illinois (IL)
Where are fire incidents reported in Springfield, IL
Something went wrong! Please refresh the page.
| Fire incidents reported | |
|---|---|
| Sreet name | Count |
| DIRKSEN PKY | 272 |
| PEORIA RD | 258 |
| MACARTHUR BLVD | 254 |
| WESLEY ST | 244 |
| JEFFERSON ST | 226 |
| 11TH ST | 218 |
| 14TH ST | 210 |
| MONROE ST | 208 |
| LIVINGSTON ST | 198 |
| LAWRENCE AVE | 178 |
| COOK ST | 174 |
| 4TH ST | 168 |
| WASHINGTON ST | 168 |
| 8TH ST | 166 |
| DOUGLAS AVE | 160 |
| 11TH | 158 |
| CARPENTER ST | 156 |
| WABASH AVE | 156 |
| 14TH | 154 |
| EDWARDS ST | 154 |
| JACKSON ST | 154 |
| 9TH ST | 152 |
| 5TH ST | 150 |
| NORTH GRAND AVE | 144 |
| WALNUT ST | 142 |
| STEPHEN AVE | 140 |
| 15TH ST | 138 |
| MILTON AVE | 138 |
| 12TH ST | 132 |
| 13TH ST | 132 |
| Other | 4,976 |
2003 - 2018 National Fire Incident Reporting System (NFIRS) incidents
- Incident types reported to NFIRS in Springfield, IL
- 43,27749.1%Rescue & EMS
- 10,27811.7%Fire
- 9,48610.8%False Alarm
- 8,80910.0%Service Call
- 8,7259.9%Good Intent Call
- 6,8777.8%Hazardous Condition
- 5920.7%Special Incident
- Fire incident types reported to NFIRS in Springfield, IL
- 4,58844.6%Outside Fires
- 3,64035.4%Structure Fires
- 1,33913.0%Mobile Property/Vehicle Fires
- 7116.9%Other
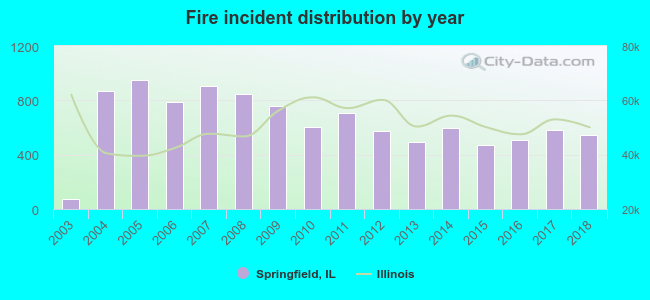 Based on the data from the years 2003 - 2018 the average number of fire incidents per year is 642. The highest number of reported fire incidents - 952 took place in 2005, and the least - 75 in 2003. The data has a rising trend.
The average number of yearly fire incidents per 10k residents in Springfield, IL compared to nearest cities:
(Note: Based on data for the last 3 years, including only cities with population 5,000 and above)
| Springfield: | 46.5 |
| Chatham: | 34.4 |
| Taylorville: | 94.2 |
| Lincoln: | 103.6 |
| Jacksonville: | 59.0 |
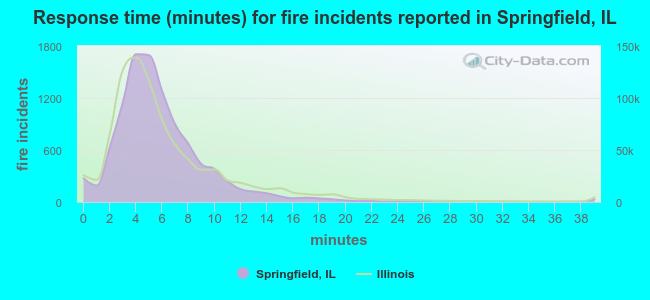 The median response time based on all reported fire incidents is 5 minutes. This is close to the Illinois median value.
The median response time in Springfield, IL compared to nearest cities:
(Note: Based on data for all years, including only cities with at least 500 fire incidents)
| Springfield: | 5 minutes |
| Sherman: | 9 minutes |
| Chatham: | 6 minutes |
| Petersburg: | 9 minutes |
| Taylorville: | 6 minutes |
| Lincoln: | 5 minutes |
| Jacksonville: | 4 minutes |
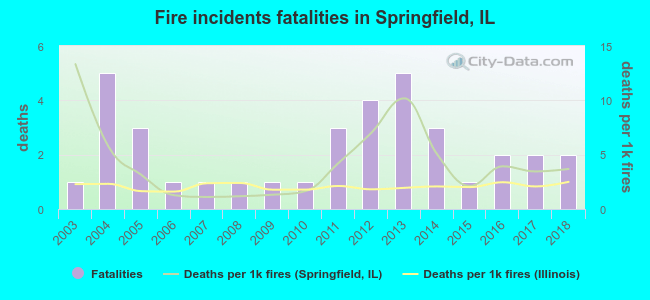 Based on the reports from the years 2003 - 2018 the average number of fire-related fatalities per year is 2. The highest number of reported deaths - 5 took place in 2004, and the lowest - 1 in 2003. The data has a growing trend.
The average number of fatalities per 1,000 fires is 4. This indicator was the highest - 13 in 2003, and the lowest 1 in 2007. The trend for fatalities per 1,000 incidents is decreasing. Compared to the state value the number of fatalities per 1,000 incidents is higher.
Based on the reports from the years 2003 - 2018 the average number of fire-related fatalities per year is 2. The highest number of reported deaths - 5 took place in 2004, and the lowest - 1 in 2003. The data has a growing trend.
The average number of fatalities per 1,000 fires is 4. This indicator was the highest - 13 in 2003, and the lowest 1 in 2007. The trend for fatalities per 1,000 incidents is decreasing. Compared to the state value the number of fatalities per 1,000 incidents is higher.Deaths per 1,000 incidents in Springfield, IL compared to nearest cities:
(Note: Based on data for all years, including only cities with at least 2,500 fire incidents)
| Springfield: | 3.5 |
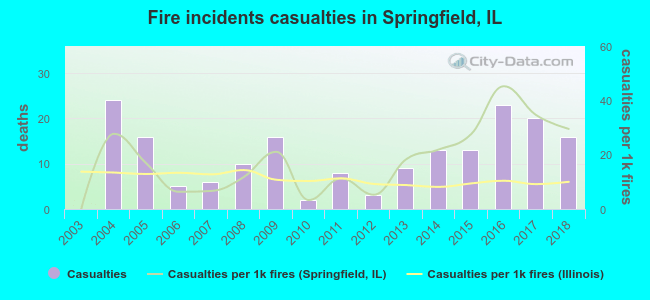 Based on the data from the years 2003 - 2018 the average number of fire-related casualties per year is 12. The highest number of reported injuries - 24 took place in 2004, and the lowest - 0 in 2003. The data has an increasing trend.
The average number of casualties per 1,000 fires is 18. This indicator was the highest - 45 in 2016, and the lowest 0 in 2003. The trend for casualties per 1,000 fire incidents is rising. Compared to the state value the number of injuries per 1,000 incidents is higher.
Based on the data from the years 2003 - 2018 the average number of fire-related casualties per year is 12. The highest number of reported injuries - 24 took place in 2004, and the lowest - 0 in 2003. The data has an increasing trend.
The average number of casualties per 1,000 fires is 18. This indicator was the highest - 45 in 2016, and the lowest 0 in 2003. The trend for casualties per 1,000 fire incidents is rising. Compared to the state value the number of injuries per 1,000 incidents is higher.Casualties per 1,000 incidents in Springfield, IL compared to nearest cities:
(Note: Based on data for all years, including only cities with at least 500 fire incidents)
| Springfield: | 17.9 |
| Sherman: | 5.8 |
| Chatham: | 8.9 |
| Petersburg: | 0.0 |
| Taylorville: | 9.2 |
| Lincoln: | 15.2 |
| Jacksonville: | 11.7 |
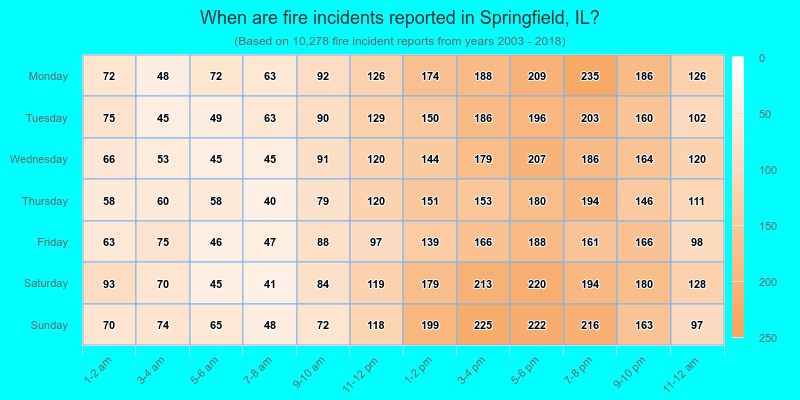
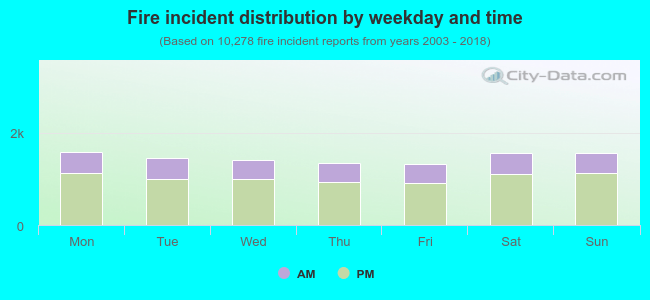 29.9% incidents where reported in the morning and 70.1% in the evening. The most fires (15.5%) took place on Monday, and the least (13.0%) on Friday.
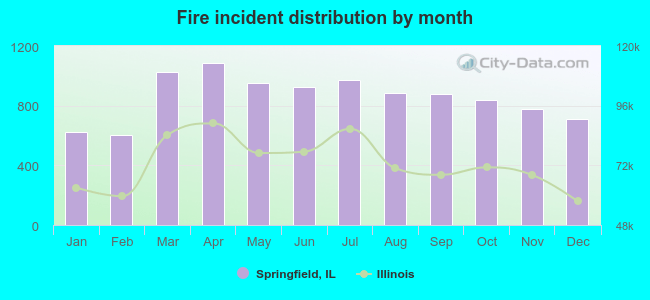 Based on the 10,278 reports from years 2003 - 2018 most fires (10.6%) took place during April, and the least (5.9%) in February.
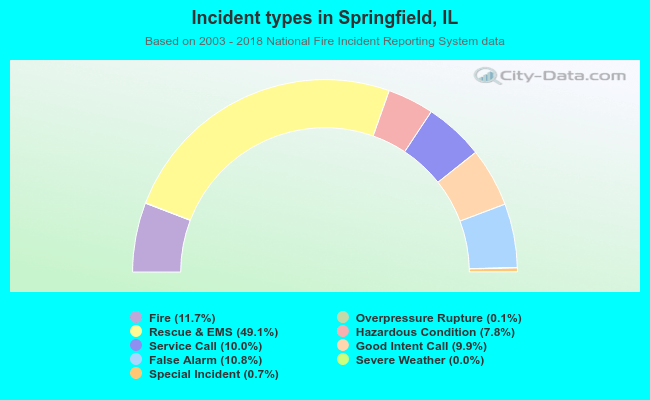 Out of all 88,115 cases reported during the years 2003 - 2018, the most belonged to the categories: Rescue & EMS (49.1%), Fire (11.7%), and False Alarm (10.8%).
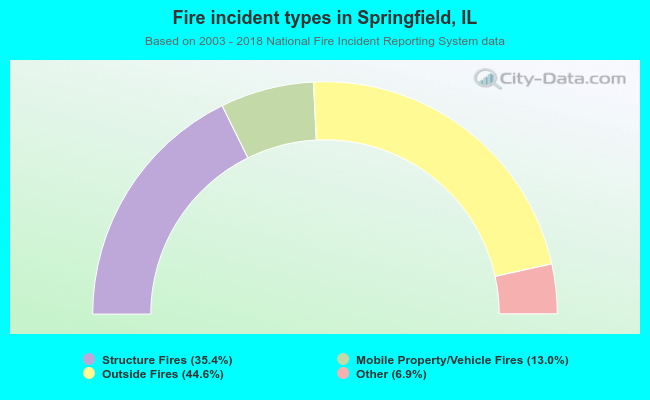 When looking into fire subcategories, the most incidents belonged to: Outside Fires (44.6%), and Structure Fires (35.4%).