Sterling Heights: Fire Incidents, Michigan (MI)
Where are fire incidents reported in Sterling Heights, MI
Something went wrong! Please refresh the page.
| Fire incidents reported | |
|---|---|
| Sreet name | Count |
| VAN DYKE | 496 |
| FIFTEEN MILE ROAD | 326 |
| MOUND ROAD | 272 |
| VAN DYKE AVE | 184 |
| DEQUINDRE ROAD | 158 |
| METROPOLITAN PARKWAY | 154 |
| SCHOENHERR ROAD | 152 |
| EIGHTEEN MILE ROAD | 136 |
| HALL ROAD | 124 |
| MOUND RD | 116 |
| NINETEEN MILE ROAD | 110 |
| FOURTEEN MILE ROAD | 100 |
| LAKESIDE CIRCLE | 98 |
| RYAN ROAD | 86 |
| SCHOENHERR RD | 76 |
| DEQUINDRE RD | 74 |
| UTICA ROAD | 74 |
| SEVENTEEN MILE ROAD | 70 |
| CLINTON RIVER ROAD | 66 |
| DODGE PARK ROAD | 60 |
| MERRILL ROAD | 54 |
| HAYES ROAD | 52 |
| PLUMBROOK ROAD | 50 |
| RYAN RD | 50 |
| 15 MILE RD | 48 |
| FIFTEEN MILE RD | 48 |
| METROPOLITAN PKY | 48 |
| CONSTITUTION BLVD | 44 |
| DOBRY DR | 38 |
| LAKESIDE CIR | 38 |
| Other | 1,556 |
2002 - 2018 National Fire Incident Reporting System (NFIRS) incidents
- Incident types reported to NFIRS in Sterling Heights, MI
- 55,88866.4%Rescue & EMS
- 9,08710.8%Service Call
- 5,1086.1%Hazardous Condition
- 4,9585.9%Fire
- 4,8065.7%Good Intent Call
- 3,4714.1%False Alarm
- 7880.9%Special Incident
- Fire incident types reported to NFIRS in Sterling Heights, MI
- 2,54951.4%Structure Fires
- 1,39428.1%Outside Fires
- 87317.6%Mobile Property/Vehicle Fires
- 1422.9%Other
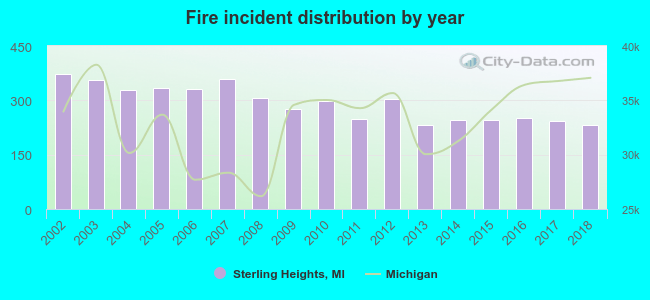 According to the data from the years 2002 - 2018 the average number of fire incidents per year is 292. The highest number of fires - 373 took place in 2002, and the least - 231 in 2013. The data has a decreasing trend.
The average number of yearly fire incidents per 10k residents in Sterling Heights, MI compared to nearest cities:
(Note: Based on data for the last 3 years, including only cities with population 5,000 and above)
| Sterling Heights: | 18.3 |
| Fraser: | 15.7 |
| Troy: | 21.2 |
| Warren: | 21.1 |
| Shelby: | 5.2 |
| Madison Heights: | 39.0 |
| Center Line: | 78.6 |
| Clawson: | 16.0 |
| Roseville: | 29.2 |
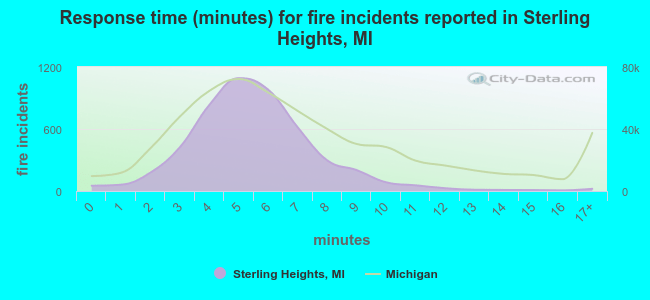 The median response time based on all reported fire incidents is 5 minutes. This is lower compared to the Michigan median value.
The median response time in Sterling Heights, MI compared to nearest cities:
(Note: Based on data for all years, including only cities with at least 500 fire incidents)
| Sterling Heights: | 5 minutes |
| Troy: | 7 minutes |
| Warren: | 5 minutes |
| Madison Heights: | 3 minutes |
| Center Line: | 3 minutes |
| Roseville: | 4 minutes |
| Mount Clemens: | 3 minutes |
| Royal Oak: | 6 minutes |
| Rochester Hills: | 6 minutes |
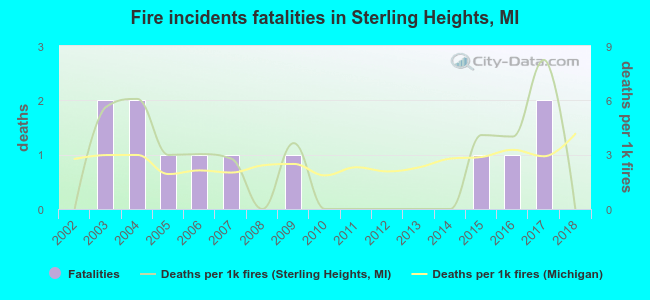 According to the data from the years 2002 - 2018 the average number of fire-related yearly deaths is 1. The highest number of reported deaths - 2 took place in 2003, and the lowest - 0 in 2002. The data has a constant trend.
The average number of deaths per 1,000 fire incidents is 2. This indicator was the highest - 8 in 2017, and the lowest 0 in 2002. The trend for fatalities per 1,000 fire incidents is constant. Compared to the state value the number of deaths per 1,000 fire incidents is about the same.
According to the data from the years 2002 - 2018 the average number of fire-related yearly deaths is 1. The highest number of reported deaths - 2 took place in 2003, and the lowest - 0 in 2002. The data has a constant trend.
The average number of deaths per 1,000 fire incidents is 2. This indicator was the highest - 8 in 2017, and the lowest 0 in 2002. The trend for fatalities per 1,000 fire incidents is constant. Compared to the state value the number of deaths per 1,000 fire incidents is about the same.
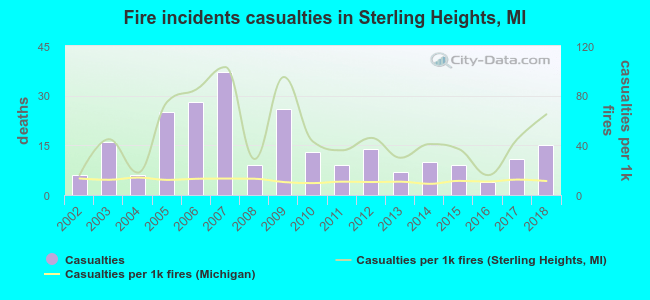 Based on the reports from the years 2002 - 2018 the average number of fire-related yearly casualties is 14. The highest number of reported casualties - 37 took place in 2007, and the lowest - 4 in 2016. The data has an increasing trend.
The average number of injuries per 1,000 fire incidents is 49. This indicator was the highest - 103 in 2007, and the lowest 16 in 2002. The trend for injuries per 1,000 incidents is rising. Compared to the Michigan value the number of injuries per 1,000 fires is much higher.
Based on the reports from the years 2002 - 2018 the average number of fire-related yearly casualties is 14. The highest number of reported casualties - 37 took place in 2007, and the lowest - 4 in 2016. The data has an increasing trend.
The average number of injuries per 1,000 fire incidents is 49. This indicator was the highest - 103 in 2007, and the lowest 16 in 2002. The trend for injuries per 1,000 incidents is rising. Compared to the Michigan value the number of injuries per 1,000 fires is much higher.Casualties per 1,000 incidents in Sterling Heights, MI compared to nearest cities:
(Note: Based on data for all years, including only cities with at least 500 fire incidents)
| Sterling Heights: | 49.4 |
| Troy: | 18.0 |
| Warren: | 24.1 |
| Madison Heights: | 10.5 |
| Center Line: | 31.9 |
| Roseville: | 12.8 |
| Mount Clemens: | 8.5 |
| Royal Oak: | 24.1 |
| Rochester Hills: | 28.1 |
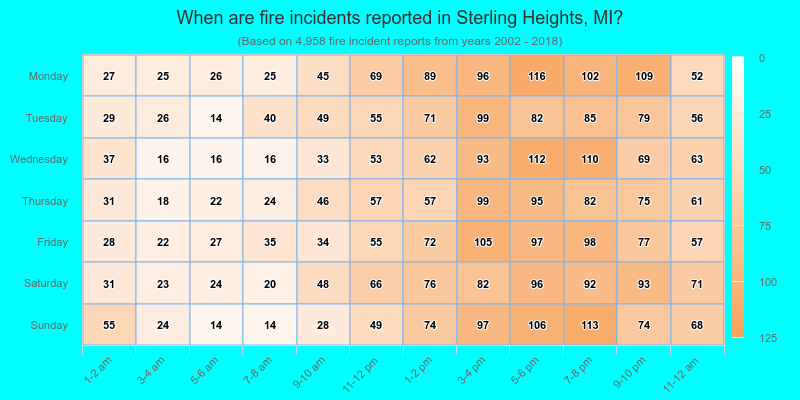
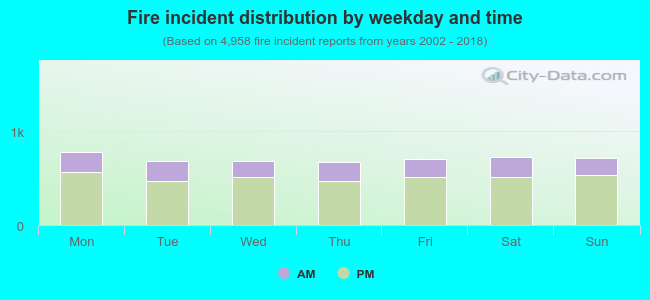 28.2% incidents where reported in the morning and 71.8% in the evening. The most fires (15.8%) took place on Monday, and the least (13.5%) on Thursday.
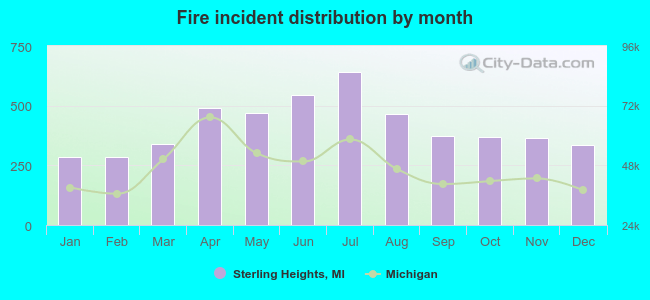 Based on the 4,958 fires from years 2002 - 2018 most fires (12.9%) took place during July, and the least (5.7%) in January.
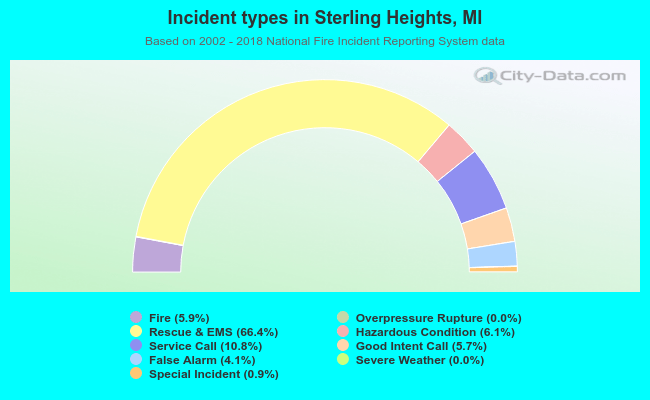 Out of all 84,159 cases reported during the years 2002 - 2018, the most belonged to the categories: Rescue & EMS (66.4%), Service Call (10.8%), and Hazardous Condition (6.1%).
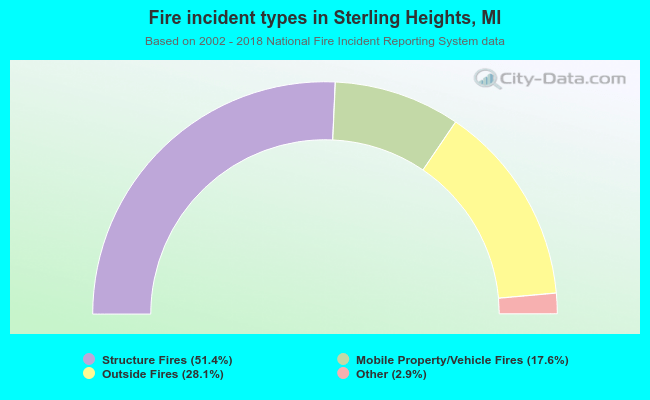 When looking into fire subcategories, the most reports belonged to: Structure Fires (51.4%), and Outside Fires (28.1%).