Suisun City: Fire Incidents, California (CA)
Where are fire incidents reported in Suisun City, CA
Something went wrong! Please refresh the page.
|
| |||||||||||||||||||||||||||||||||||||||||||||||||||||||||||||||||||||||||||||||||||||||||||||||||||||||||||||
2005 - 2018 National Fire Incident Reporting System (NFIRS) incidents
- Incident types reported to NFIRS in Suisun City, CA
- 5,13072.0%Rescue & EMS
- 5798.1%Service Call
- 5287.4%Good Intent Call
- 5087.1%Fire
- 2303.2%False Alarm
- 1341.9%Hazardous Condition
- 80.1%Special Incident
- Fire incident types reported to NFIRS in Suisun City, CA
- 23045.3%Outside Fires
- 13827.2%Other
- 9318.3%Structure Fires
- 479.3%Mobile Property/Vehicle Fires
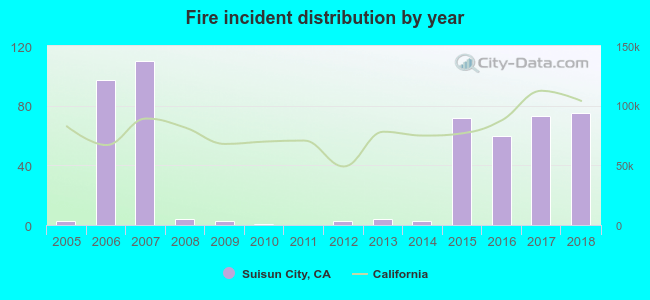 Based on the data from the years 2005 - 2018 the average number of fires per year is 36. The highest number of reported fires - 110 took place in 2007, and the least - 0 in 2011. The data has a growing trend.
The average number of yearly fire incidents per 10k residents in Suisun City, CA compared to nearest cities:
(Note: Based on data for the last 3 years, including only cities with population 5,000 and above)
| Suisun City: | 23.7 |
| Fairfield: | 9.0 |
| Vacaville: | 20.9 |
| American Canyon: | 14.5 |
| Benicia: | 27.3 |
| Vallejo: | 19.0 |
| Bay Point: | 54.3 |
| Napa: | 27.3 |
| Pittsburg: | 31.1 |
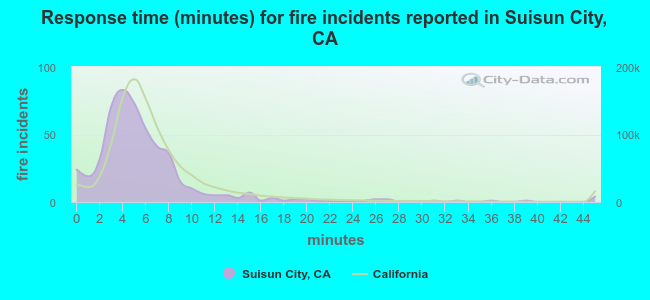 The median response time based on all reported fire incidents is 5 minutes. This is lower compared to the state median value.
The median response time in Suisun City, CA compared to nearest cities:
(Note: Based on data for all years, including only cities with at least 500 fire incidents)
| Suisun City: | 5 minutes |
| Fairfield: | 7 minutes |
| Vacaville: | 7 minutes |
| American Canyon: | 5 minutes |
| Benicia: | 6 minutes |
| Vallejo: | 5 minutes |
| Bay Point: | 7 minutes |
| Napa: | 6 minutes |
| Pittsburg: | 6 minutes |
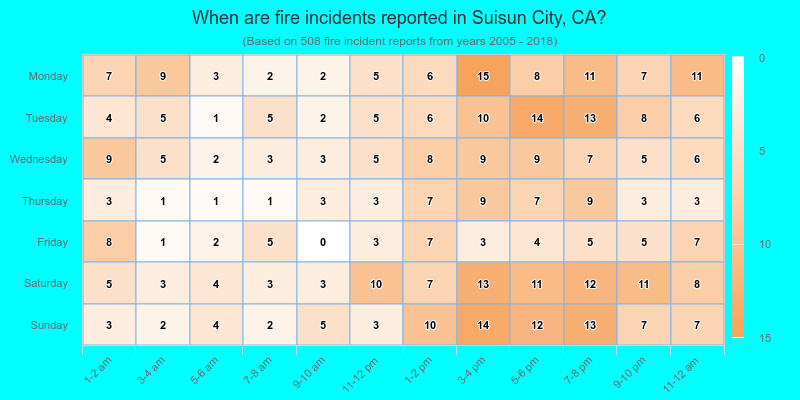
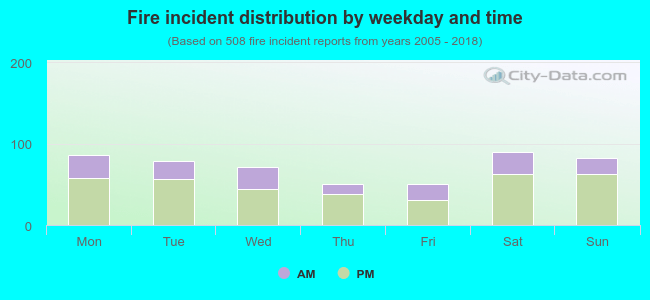 30.5% incidents where reported in the morning and 69.5% in the evening. The most fires (17.7%) took place on Saturday, and the least (9.8%) on Thursday.
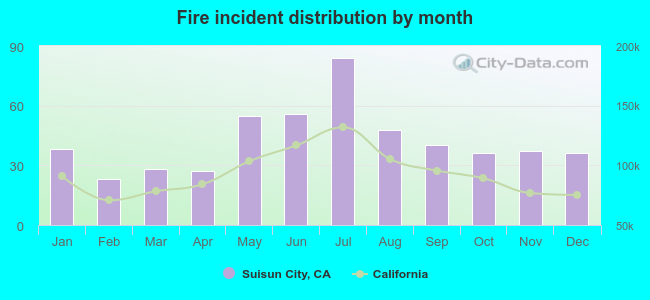 Based on the 508 reports from years 2005 - 2018 most fires (16.5%) took place during July, and the least (4.5%) in February.
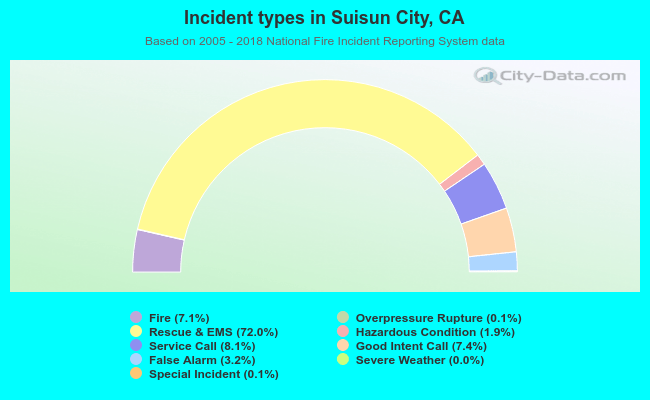 Out of all 7,122 cases reported during the years 2005 - 2018, the most belonged to the categories: Rescue & EMS (72.0%), Service Call (8.1%), and Good Intent Call (7.4%).
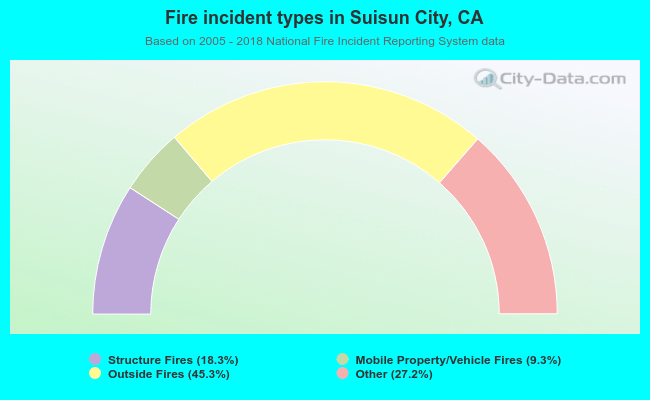 When looking into fire subcategories, the most incidents belonged to: Outside Fires (45.3%), and Other (27.2%).