Swissvale: Fire Incidents, Pennsylvania (PA)
Where are fire incidents reported in Swissvale, PA
Something went wrong! Please refresh the page.
|
| |||||||||||||||||||||||||||||||||||||||||||||||||||||||||||||||||||||||||||||||||||||||||||||||||||||||||||||
2004 - 2018 National Fire Incident Reporting System (NFIRS) incidents
- Incident types reported to NFIRS in Swissvale, PA
- 84243.3%Rescue & EMS
- 37919.5%Fire
- 29415.1%Good Intent Call
- 1668.5%False Alarm
- 1598.2%Hazardous Condition
- 934.8%Service Call
- 70.4%Special Incident
- 30.2%Overpressure Rupture
- 30.2%Severe Weather
- Fire incident types reported to NFIRS in Swissvale, PA
- 32986.8%Structure Fires
- 287.4%Outside Fires
- 154.0%Other
- 71.8%Mobile Property/Vehicle Fires
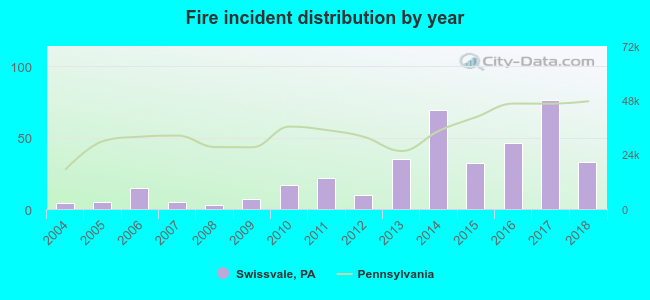 Based on the data from the years 2004 - 2018 the average number of fires per year is 25. The highest number of reported fires - 76 took place in 2017, and the least - 3 in 2008. The data has a rising trend.
The average number of yearly fire incidents per 10k residents in Swissvale, PA compared to nearest cities:
(Note: Based on data for the last 3 years, including only cities with population 5,000 and above)
| Swissvale: | 58.0 |
| Wilkinsburg: | 31.6 |
| Forest Hills: | 31.9 |
| Munhall: | 46.6 |
| Turtle Creek: | 43.4 |
| West Mifflin: | 48.2 |
| Duquesne: | 61.6 |
| Penn Hills: | 18.7 |
| North Versailles: | 41.8 |
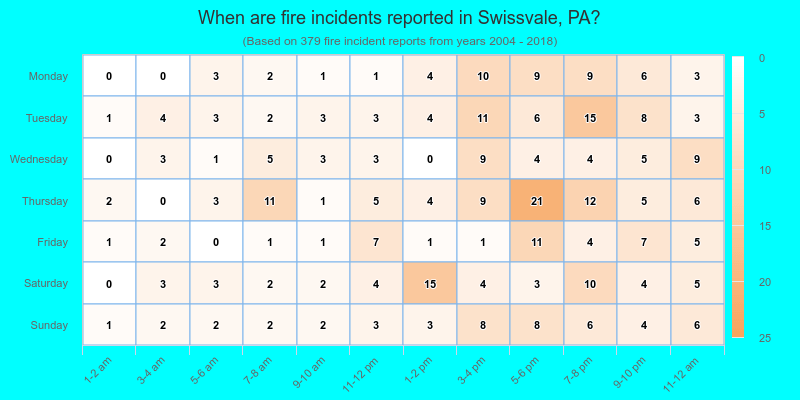
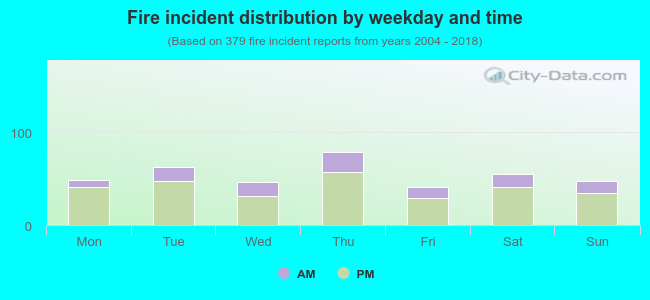 25.9% incidents where reported in the morning and 74.1% in the evening. The most fires (20.8%) took place on Thursday, and the least (10.8%) on Friday.
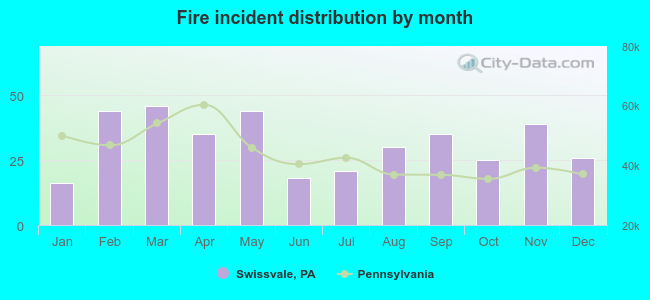 Based on the 379 fire incidents from years 2004 - 2018 most fires (12.1%) took place during March, and the least (4.2%) in January.
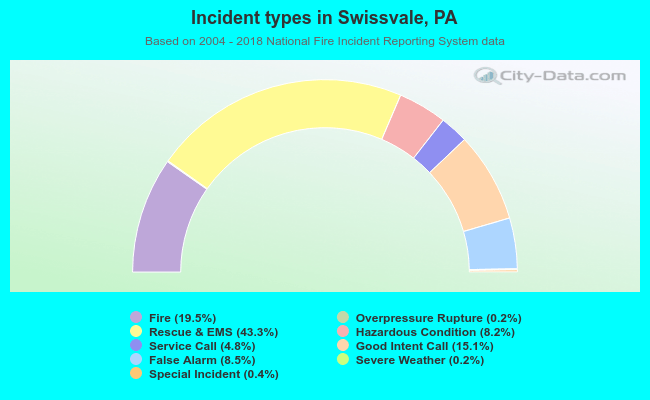 Out of all 1,946 cases reported during the years 2004 - 2018, the most belonged to the categories: Rescue & EMS (43.3%), Fire (19.5%), and Good Intent Call (15.1%).
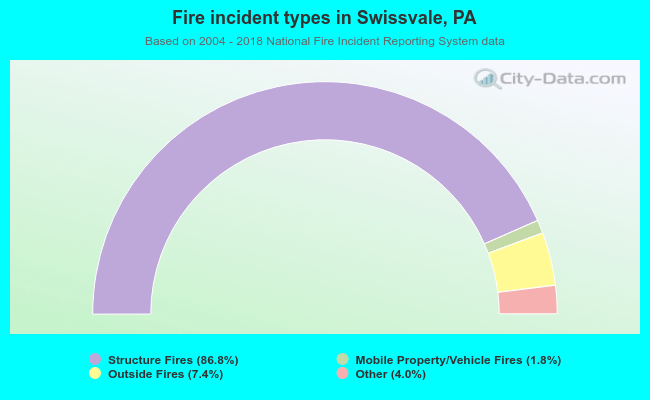 When looking into fire subcategories, the most reports belonged to: Structure Fires (86.8%), and Outside Fires (7.4%).