Sylvan Grove: Fire Incidents, Kansas (KS)
Where are fire incidents reported in Sylvan Grove, KS
Something went wrong! Please refresh the page.
|
| |||||||||||||||||||||||||||||||||||||||||||||||||||||||||||||||||||||||||||||||||||||||||||||||||||||||||||||
| Other | 15 | |||||||||||||||||||||||||||||||||||||||||||||||||||||||||||||||||||||||||||||||||||||||||||||||||||||||||||||
2004 - 2018 National Fire Incident Reporting System (NFIRS) incidents
- Incident types reported to NFIRS in Sylvan Grove, KS
- 16181.7%Fire
- 3417.3%Hazardous Condition
- 10.5%Rescue & EMS
- 10.5%Good Intent Call
- Fire incident types reported to NFIRS in Sylvan Grove, KS
- 11571.4%Outside Fires
- 3018.6%Structure Fires
- 159.3%Mobile Property/Vehicle Fires
- 10.6%Other
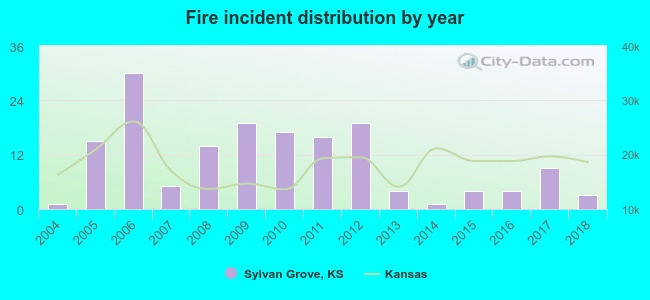 Based on the data from the years 2004 - 2018 the average number of fires per year is 11. The highest number of fires - 30 took place in 2006, and the least - 1 in 2004. The data has a growing trend.
 23.6% incidents where reported in the morning and 76.4% in the evening. The most fires (18.0%) took place on Saturday, and the least (11.2%) on Tuesday.
 Based on the 161 reports from years 2004 - 2018 most fires (20.5%) took place during July, and the least (3.1%) in September.
 Out of all 197 cases reported during the years 2004 - 2018, the most belonged to the categories: Fire (81.7%), Rescue & EMS (17.3%), and Overpressure Rupture (0.5%).
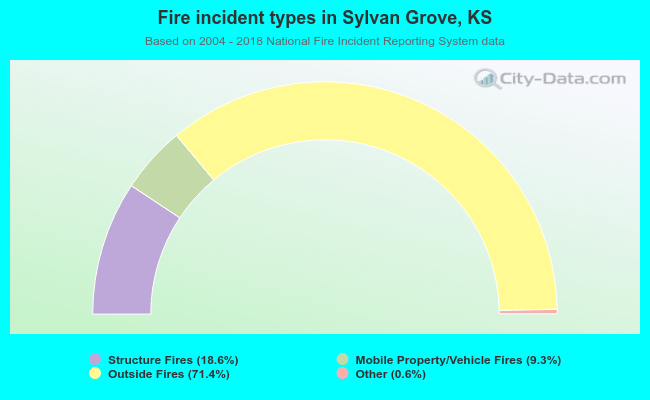 When looking into fire subcategories, the most incidents belonged to: Outside Fires (71.4%), and Structure Fires (18.6%).