Terrytown: Fire Incidents, Louisiana (LA)
Where are fire incidents reported in Terrytown, LA
Something went wrong! Please refresh the page.
| Fire incidents reported | |
|---|---|
| Sreet name | Count |
| WALL BLVD | 230 |
| TERRY PKY | 182 |
| MONTEREY CT | 154 |
| CAROL SUE AVE | 120 |
| BELLE CHASSE HWY | 118 |
| BEHRMAN HWY | 108 |
| HOLMES BLVD | 102 |
| LAPALCO BLVD | 96 |
| WHITNEY AVE | 94 |
| DEERFIELD RD | 90 |
| CARROLLWOOD VILLAGE DR | 88 |
| PARK PLACE DR | 82 |
| WESTBANK EXPY | 82 |
| WRIGHT AVE | 74 |
| HERITAGE AVE | 60 |
| RUBY ST | 60 |
| STUMPF BLVD | 60 |
| CAROLWOOD VILLAGE DR | 58 |
| FRIEDRICHS RD | 54 |
| FAITH PL | 52 |
| OAKWOOD DR | 52 |
| FAIRFIELD AVE | 48 |
| FARMINGTON PL | 48 |
| HELEN ST | 46 |
| COMMERCE ST | 42 |
| BELLEMEADE BLVD | 40 |
| FORESTLAWN DR | 36 |
| WILLOWBROOK DR | 32 |
| HECTOR AVE | 30 |
| PARKPLACE DR | 30 |
2002 - 2018 National Fire Incident Reporting System (NFIRS) incidents
- Incident types reported to NFIRS in Terrytown, LA
- 1,97727.9%Fire
- 1,59122.5%Hazardous Condition
- 1,32718.8%False Alarm
- 1,04514.8%Rescue & EMS
- 6789.6%Service Call
- 4145.9%Good Intent Call
- 270.4%Severe Weather
- 110.2%Overpressure Rupture
- Fire incident types reported to NFIRS in Terrytown, LA
- 1,06553.9%Structure Fires
- 55928.3%Outside Fires
- 32116.2%Mobile Property/Vehicle Fires
- 321.6%Other
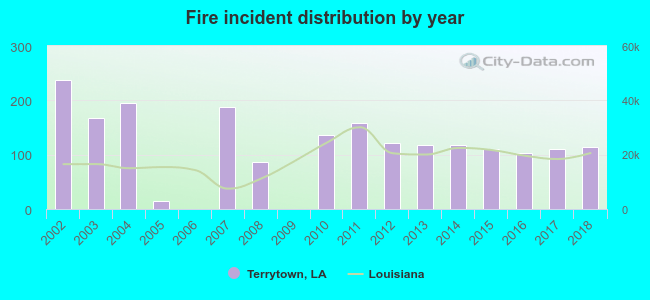 Based on the data from the years 2002 - 2018 the average number of fire incidents per year is 116. The highest number of reported fires - 237 took place in 2002, and the least - 0 in 2006. The data has a dropping trend.
The average number of yearly fire incidents per 10k residents in Terrytown, LA compared to nearest cities:
(Note: Based on data for the last 3 years, including only cities with population 5,000 and above)
| Terrytown: | 46.7 |
| Gretna: | 38.5 |
| Harvey: | 77.3 |
| Belle Chasse: | 59.7 |
| Marrero: | 60.6 |
| Chalmette: | 55.9 |
| New Orleans: | 17.3 |
| Westwego: | 38.6 |
| Meraux: | 44.7 |
 The median response time based on all reported fire incidents is 4 minutes. This is lower compared to the state median value.
The median response time in Terrytown, LA compared to nearest cities:
(Note: Based on data for all years, including only cities with at least 500 fire incidents)
| Terrytown: | 4 minutes |
| Gretna: | 3 minutes |
| Harvey: | 4 minutes |
| Belle Chasse: | 4 minutes |
| Marrero: | 4 minutes |
| Chalmette: | 4 minutes |
| New Orleans: | 5 minutes |
| Westwego: | 2 minutes |
| Violet: | 4 minutes |
 According to the data from the years 2002 - 2018 the average number of fire-related fatalities per year is 0. The highest number of deaths - 1 took place in 2010, and the lowest - 0 in 2002. The data has a constant trend.
 According to the data from the years 2002 - 2018 the average number of fire-related yearly casualties is 1. The highest number of injuries - 5 took place in 2002, and the lowest - 0 in 2006. The data has a decreasing trend.
The average number of casualties per 1,000 fires is 12. This indicator was the highest - 67 in 2005, and the lowest 0 in 2006. The trend for injuries per 1,000 fires is declining. Compared to the Louisiana value the number of injuries per 1,000 fire incidents is much higher.
According to the data from the years 2002 - 2018 the average number of fire-related yearly casualties is 1. The highest number of injuries - 5 took place in 2002, and the lowest - 0 in 2006. The data has a decreasing trend.
The average number of casualties per 1,000 fires is 12. This indicator was the highest - 67 in 2005, and the lowest 0 in 2006. The trend for injuries per 1,000 fires is declining. Compared to the Louisiana value the number of injuries per 1,000 fire incidents is much higher.Casualties per 1,000 incidents in Terrytown, LA compared to nearest cities:
(Note: Based on data for all years, including only cities with at least 500 fire incidents)
| Terrytown: | 11.6 |
| Gretna: | 4.7 |
| Harvey: | 7.9 |
| Belle Chasse: | 8.3 |
| Marrero: | 3.4 |
| Chalmette: | 12.5 |
| New Orleans: | 3.7 |
| Westwego: | 7.5 |
| Violet: | 17.4 |
 30.2% incidents where reported in the morning and 69.8% in the evening. The most fires (15.6%) took place on Thursday, and the least (12.3%) on Friday.
 Based on the 1,977 fires from years 2002 - 2018 most fires (10.8%) took place during January, and the least (6.3%) in September.
 Out of all 7,074 cases reported during the years 2002 - 2018, the most belonged to the categories: Fire (27.9%), Hazardous Condition (22.5%), and False Alarm (18.8%).
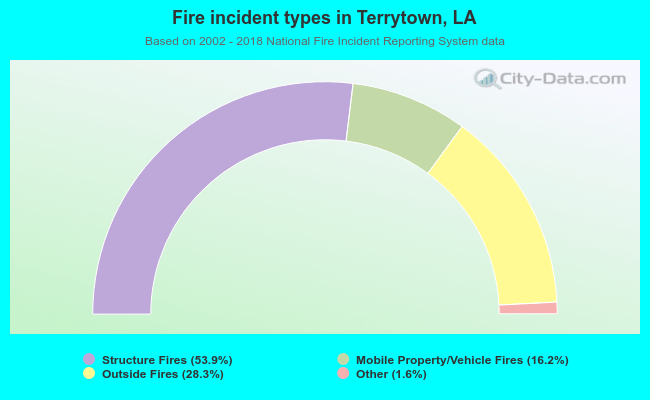 When looking into fire subcategories, the most incidents belonged to: Structure Fires (53.9%), and Outside Fires (28.3%).