Traverse City: Fire Incidents, Michigan (MI)
Where are fire incidents reported in Traverse City, MI
Something went wrong! Please refresh the page.
| Fire incidents reported | |
|---|---|
| Sreet name | Count |
| FRONT ST | 182 |
| SOUTH AIRPORT RD | 170 |
| OUT OF CITY GARFIELD TWP RD | 168 |
| US 31 SOUTH | 140 |
| US 31 NORTH | 108 |
| EIGHTH ST | 92 |
| NORTH LONG LAKE RD | 84 |
| CENTER RD | 76 |
| PENINSULA DR | 76 |
| WEST BAY SHORE DR | 74 |
| GARFIELD RD | 70 |
| OUT OF CITY PENINSULA TWP RD | 60 |
| CASS RD | 56 |
| CEDAR RUN RD | 54 |
| DIVISION ST | 54 |
| M 37 | 54 |
| WEST SILVER LAKE RD | 54 |
| BLAIR TOWNHALL RD | 52 |
| HAMMOND RD | 48 |
| MUNSON AVE | 48 |
| BARLOW ST | 46 |
| GARFIELD AVE | 46 |
| FOUR MILE RD | 42 |
| VANCE RD | 42 |
| ELEVENTH ST | 40 |
| RIVER RD | 40 |
| KEYSTONE RD | 38 |
| MOBILE TRL | 38 |
| UNION ST | 38 |
| BLUFF RD | 36 |
| Other | 1,436 |
2002 - 2018 National Fire Incident Reporting System (NFIRS) incidents
- Incident types reported to NFIRS in Traverse City, MI
- 28,67761.8%Rescue & EMS
- 5,07810.9%Hazardous Condition
- 3,6827.9%Good Intent Call
- 3,5627.7%Fire
- 3,2176.9%False Alarm
- 2,0234.4%Service Call
- 770.2%Special Incident
- 740.2%Severe Weather
- 470.1%Overpressure Rupture
- Fire incident types reported to NFIRS in Traverse City, MI
- 1,51342.5%Structure Fires
- 1,26835.6%Outside Fires
- 60316.9%Mobile Property/Vehicle Fires
- 1785.0%Other
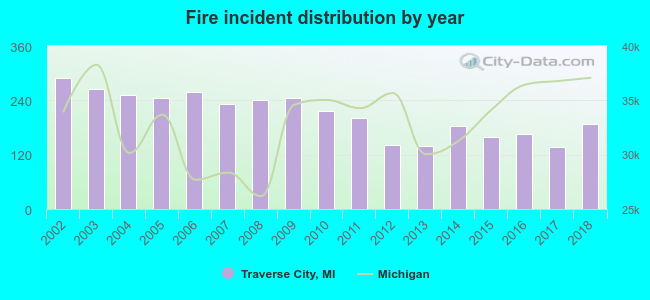 Based on the data from the years 2002 - 2018 the average number of fires per year is 210. The highest number of fire incidents - 290 took place in 2002, and the least - 136 in 2017. The data has a decreasing trend.
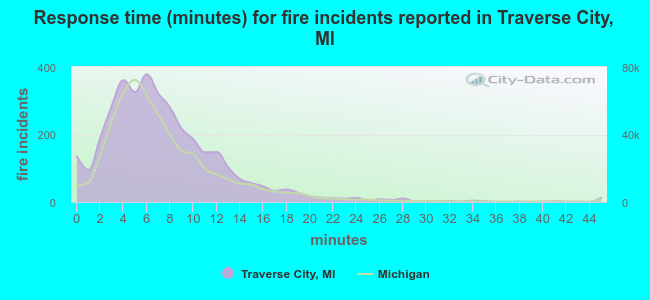 The median response time based on all reported fire incidents is 7 minutes. This is about the same as the state median value.
The median response time in Traverse City, MI compared to nearest cities:
(Note: Based on data for all years, including only cities with at least 500 fire incidents)
| Traverse City: | 7 minutes |
| Fife Lake: | 11 minutes |
| Mancelona: | 11 minutes |
| Lake City: | 11 minutes |
| Cadillac: | 7 minutes |
| Charlevoix: | 8 minutes |
| Grayling: | 13 minutes |
| Gaylord: | 10 minutes |
| Manistee: | 5 minutes |
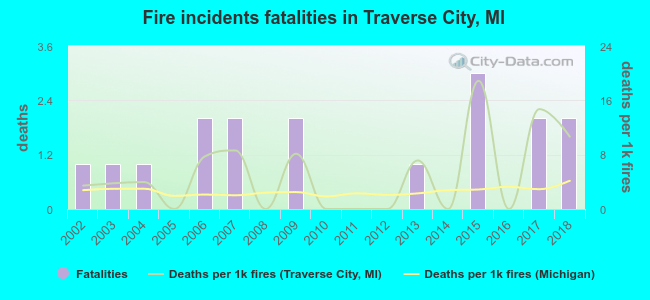 Based on the reports from the years 2002 - 2018 the average number of fire-related fatalities per year is 1. The highest number of reported deaths - 3 took place in 2015, and the lowest - 0 in 2005. The data has a rising trend.
The average number of deaths per 1,000 fire incidents is 5. This indicator was the highest - 19 in 2015, and the lowest 0 in 2005. The trend for fatalities per 1,000 fires is rising. Compared to the state value the number of fatalities per 1,000 incidents is higher.
Based on the reports from the years 2002 - 2018 the average number of fire-related fatalities per year is 1. The highest number of reported deaths - 3 took place in 2015, and the lowest - 0 in 2005. The data has a rising trend.
The average number of deaths per 1,000 fire incidents is 5. This indicator was the highest - 19 in 2015, and the lowest 0 in 2005. The trend for fatalities per 1,000 fires is rising. Compared to the state value the number of fatalities per 1,000 incidents is higher.Deaths per 1,000 incidents in Traverse City, MI compared to nearest cities:
(Note: Based on data for all years, including only cities with at least 2,500 fire incidents)
| Traverse City: | 4.8 |
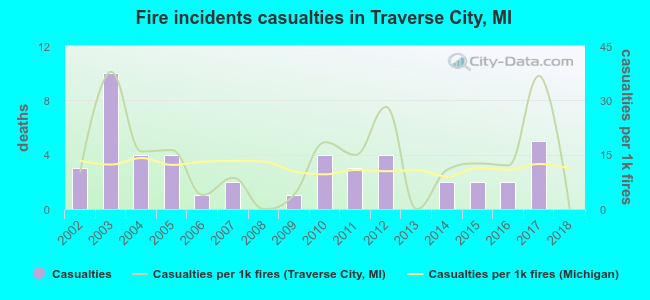 Based on the reports from the years 2002 - 2018 the average number of fire-related yearly casualties is 3. The highest number of injuries - 10 took place in 2003, and the lowest - 0 in 2008. The data has a decreasing trend.
The average number of casualties per 1,000 fires is 14. This indicator was the highest - 38 in 2003, and the lowest 0 in 2008. The trend for casualties per 1,000 fire incidents is decreasing. Compared to the Michigan value the number of injuries per 1,000 fire incidents is about the same.
Based on the reports from the years 2002 - 2018 the average number of fire-related yearly casualties is 3. The highest number of injuries - 10 took place in 2003, and the lowest - 0 in 2008. The data has a decreasing trend.
The average number of casualties per 1,000 fires is 14. This indicator was the highest - 38 in 2003, and the lowest 0 in 2008. The trend for casualties per 1,000 fire incidents is decreasing. Compared to the Michigan value the number of injuries per 1,000 fire incidents is about the same.
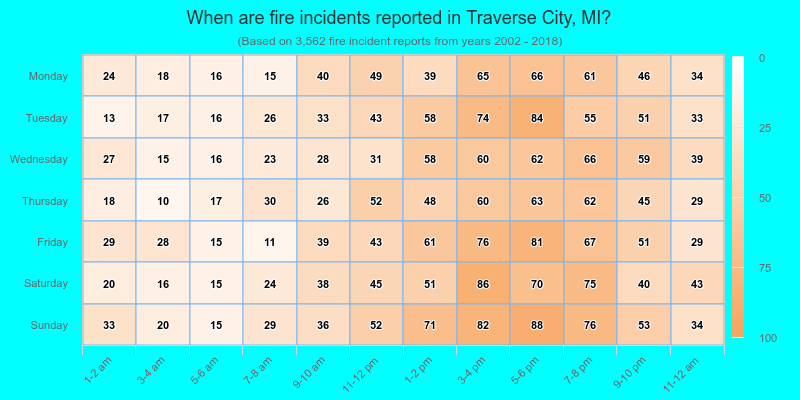
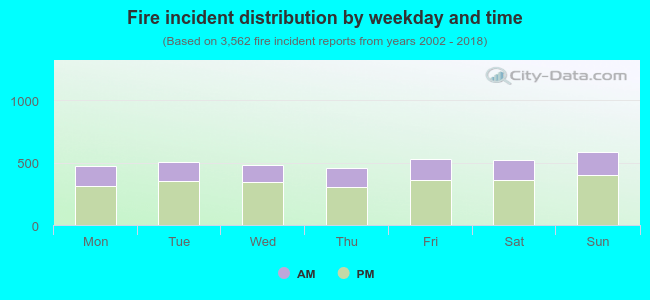 31.2% incidents where reported in the morning and 68.8% in the evening. The most fires (16.5%) took place on Sunday, and the least (12.9%) on Thursday.
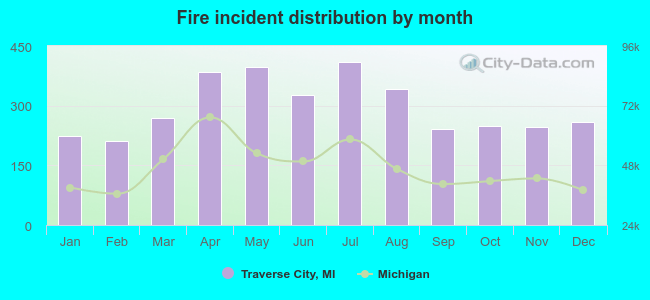 According to the 3,562 fire incidents from years 2002 - 2018 most fires (11.5%) took place during July, and the least (6.0%) in February.
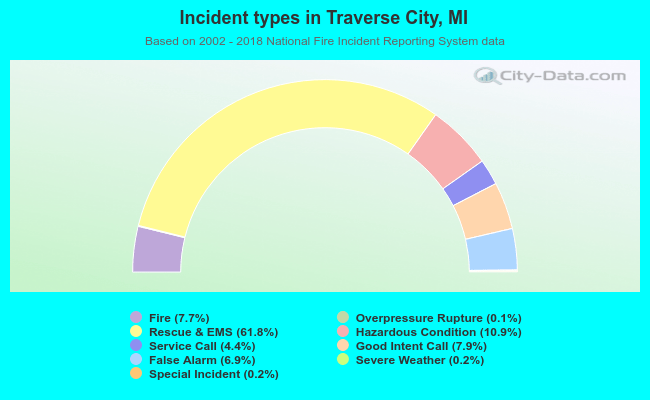 Out of all 46,437 cases reported during the years 2002 - 2018, the most belonged to the categories: Rescue & EMS (61.8%), Hazardous Condition (10.9%), and Good Intent Call (7.9%).
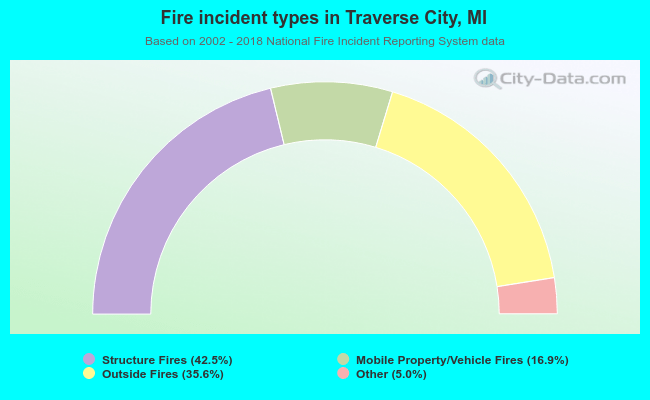 When looking into fire subcategories, the most incidents belonged to: Structure Fires (42.5%), and Outside Fires (35.6%).