Watseka: Fire Incidents, Illinois (IL)
Where are fire incidents reported in Watseka, IL
Something went wrong! Please refresh the page.
|
| |||||||||||||||||||||||||||||||||||||||||||||||||||||||||||||||||||||||||||||||||||||||||||||||||||||||||||||
| Other | 48 | |||||||||||||||||||||||||||||||||||||||||||||||||||||||||||||||||||||||||||||||||||||||||||||||||||||||||||||
2003 - 2018 National Fire Incident Reporting System (NFIRS) incidents
- Incident types reported to NFIRS in Watseka, IL
- 57233.9%Fire
- 45426.9%Hazardous Condition
- 40824.2%Rescue & EMS
- 995.9%Good Intent Call
- 875.2%False Alarm
- 523.1%Service Call
- 60.4%Overpressure Rupture
- 50.3%Severe Weather
- 30.2%Special Incident
- Fire incident types reported to NFIRS in Watseka, IL
- 29351.2%Structure Fires
- 17430.4%Outside Fires
- 569.8%Mobile Property/Vehicle Fires
- 498.6%Other
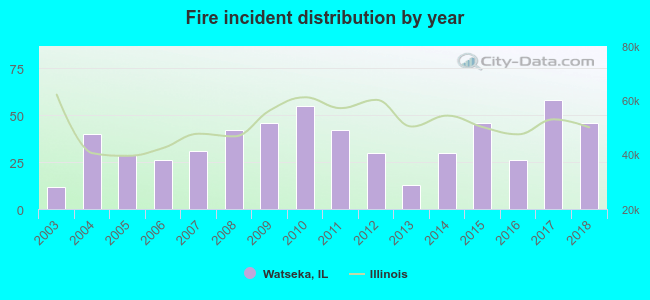 Based on the data from the years 2003 - 2018 the average number of fires per year is 36. The highest number of reported fires - 58 took place in 2017, and the least - 12 in 2003. The data has a rising trend.
The average number of yearly fire incidents per 10k residents in Watseka, IL compared to nearest cities:
(Note: Based on data for the last 3 years, including only cities with population 5,000 and above)
| Watseka: | 84.8 |
| Hoopeston: | 63.4 |
| Kankakee: | 93.8 |
| Bradley: | 35.3 |
| Bourbonnais: | 49.1 |
| Manteno: | 77.2 |
 The median response time based on all reported fire incidents is 8 minutes. This is higher compared to the state median value.
The median response time in Watseka, IL compared to nearest cities:
(Note: Based on data for all years, including only cities with at least 500 fire incidents)
| Watseka: | 8 minutes |
| St. Anne: | 11 minutes |
| Hopkins Park: | 17 minutes |
| Hoopeston: | 5 minutes |
| Kankakee: | 4 minutes |
| Bradley: | 6 minutes |
| Momence: | 10 minutes |
| Bourbonnais: | 6 minutes |
| Grant Park: | 8 minutes |
 35.0% incidents where reported in the morning and 65.0% in the evening. The most fires (17.5%) took place on Friday, and the least (12.6%) on Wednesday.
 Based on the 572 incident reports from years 2003 - 2018 most fires (11.2%) took place during March, and the least (5.1%) in September.
 Out of all 1,686 cases reported during the years 2003 - 2018, the most belonged to the categories: Fire (33.9%), Hazardous Condition (26.9%), and Rescue & EMS (24.2%).
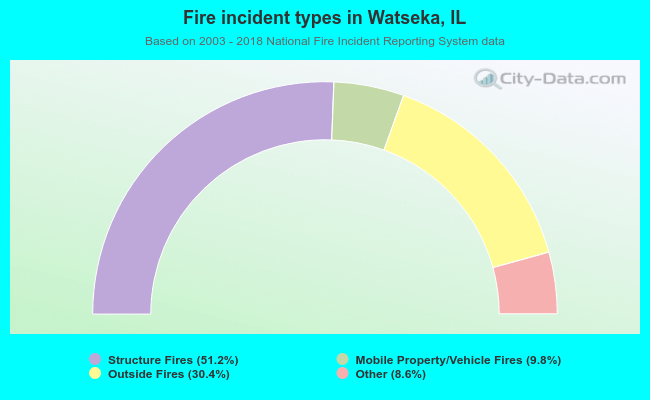 When looking into fire subcategories, the most reports belonged to: Structure Fires (51.2%), and Outside Fires (30.4%).