Waycross: Fire Incidents, Georgia (GA)
Where are fire incidents reported in Waycross, GA
Something went wrong! Please refresh the page.
| Fire incidents reported | |
|---|---|
| Sreet name | Count |
| MEMORIAL DR | 182 |
| ALBANY AVE | 152 |
| CARSWELL AVE | 144 |
| SWAMP RD | 140 |
| MINNESOTA AVE | 114 |
| VALDOSTA HWY | 96 |
| KNIGHT AVE | 88 |
| STATE ST | 78 |
| CENTRAL AVE | 76 |
| GLENMORE AVE | 74 |
| PLANT AVE | 72 |
| BROWN DR | 66 |
| US 1 HWY | 66 |
| TEBEAU ST | 64 |
| JACKSONVILLE HWY | 60 |
| JAMESTOWN RD | 58 |
| SWAMP RD. | 58 |
| HWY 84 HWY | 56 |
| BRUNSWICK HWY | 54 |
| INDUSTRIAL BLVD | 52 |
| WADLEY RD | 52 |
| ALMA HWY | 50 |
| FULFORD RD | 50 |
| CHEROKEE AVE | 48 |
| WARING ST | 48 |
| BLACKWELL ST | 44 |
| US 1 | 44 |
| ALBANY HWY | 42 |
| NEEDHAM RD | 42 |
| GILMORE ST | 40 |
| Other | 2,395 |
2002 - 2018 National Fire Incident Reporting System (NFIRS) incidents
- Incident types reported to NFIRS in Waycross, GA
- 4,60530.2%Fire
- 3,49522.9%Rescue & EMS
- 2,90719.0%Hazardous Condition
- 1,81511.9%Service Call
- 1,52910.0%Good Intent Call
- 8275.4%False Alarm
- 400.3%Overpressure Rupture
- 300.2%Severe Weather
- Fire incident types reported to NFIRS in Waycross, GA
- 2,48153.9%Outside Fires
- 1,46131.7%Structure Fires
- 62513.6%Mobile Property/Vehicle Fires
- 380.8%Other
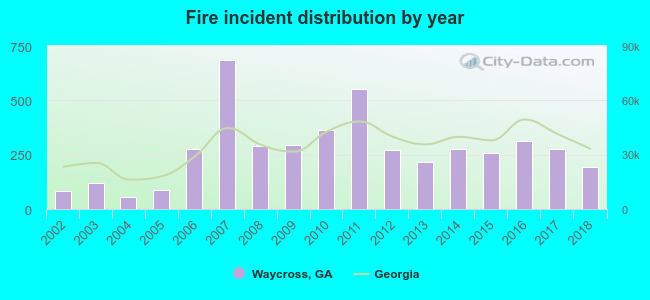 Based on the data from the years 2002 - 2018 the average number of fire incidents per year is 271. The highest number of fires - 687 took place in 2007, and the least - 57 in 2004. The data has an increasing trend.
The average number of yearly fire incidents per 10k residents in Waycross, GA compared to nearest cities:
(Note: Based on data for the last 3 years, including only cities with population 5,000 and above)
| Waycross: | 184.5 |
| Waynesville: | 25.4 |
| Folkston: | 190.8 |
| Douglas: | 164.0 |
| Jesup: | 59.0 |
| Thalmann: | 1.5 |
| Kingsland: | 62.1 |
| Dock Junction: | 2.6 |
| Everett: | 0.6 |
 The median response time based on all reported fire incidents is 8 minutes. This is higher compared to the Georgia median value.
The median response time in Waycross, GA compared to nearest cities:
(Note: Based on data for all years, including only cities with at least 500 fire incidents)
| Waycross: | 8 minutes |
| Blackshear: | 7 minutes |
| Alma: | 8 minutes |
| Folkston: | 9 minutes |
| Douglas: | 6 minutes |
| Jesup: | 9 minutes |
| Baxley: | 7 minutes |
| Woodbine: | 7 minutes |
| Hilliard: | 12 minutes |
 According to the reports from the years 2002 - 2018 the average number of fire-related fatalities per year is 1. The highest number of deaths - 2 took place in 2009, and the lowest - 0 in 2002. The data has a growing trend.
The average number of deaths per 1,000 fire incidents is 2. This indicator was the highest - 8 in 2003, and the lowest 0 in 2002. The trend for fatalities per 1,000 incidents is growing. Compared to the Georgia value the number of deaths per 1,000 fires is about the same.
According to the reports from the years 2002 - 2018 the average number of fire-related fatalities per year is 1. The highest number of deaths - 2 took place in 2009, and the lowest - 0 in 2002. The data has a growing trend.
The average number of deaths per 1,000 fire incidents is 2. This indicator was the highest - 8 in 2003, and the lowest 0 in 2002. The trend for fatalities per 1,000 incidents is growing. Compared to the Georgia value the number of deaths per 1,000 fires is about the same.
 According to the data from the years 2002 - 2018 the average number of fire-related casualties per year is 5. The highest number of reported injuries - 10 took place in 2009, and the lowest - 0 in 2004. The data has a rising trend.
The average number of casualties per 1,000 fires is 20. This indicator was the highest - 42 in 2013, and the lowest 0 in 2004. The trend for casualties per 1,000 fires is decreasing. Compared to the Georgia value the number of injuries per 1,000 fire incidents is higher.
According to the data from the years 2002 - 2018 the average number of fire-related casualties per year is 5. The highest number of reported injuries - 10 took place in 2009, and the lowest - 0 in 2004. The data has a rising trend.
The average number of casualties per 1,000 fires is 20. This indicator was the highest - 42 in 2013, and the lowest 0 in 2004. The trend for casualties per 1,000 fires is decreasing. Compared to the Georgia value the number of injuries per 1,000 fire incidents is higher.
 30.2% incidents where reported in the morning and 69.8% in the evening. The most fires (15.8%) took place on Saturday, and the least (13.1%) on Thursday.
 According to the 4,605 fire incident reports from years 2002 - 2018 most fires (13.7%) took place during May, and the least (5.7%) in August.
 Out of all 15,262 cases reported during the years 2002 - 2018, the most belonged to the categories: Fire (30.2%), Rescue & EMS (22.9%), and Hazardous Condition (19.0%).
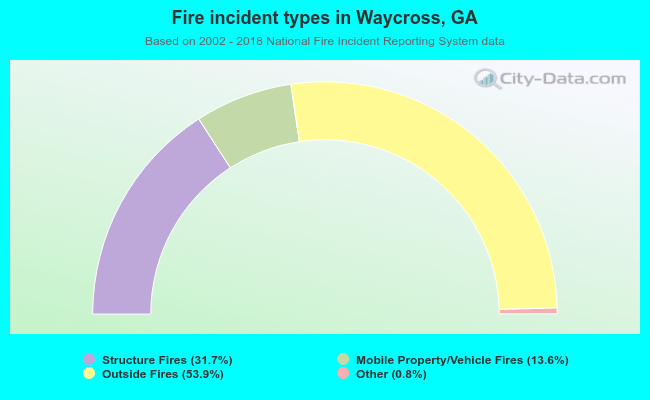 When looking into fire subcategories, the most incidents belonged to: Outside Fires (53.9%), and Structure Fires (31.7%).