West Sacramento: Fire Incidents, California (CA)
Where are fire incidents reported in West Sacramento, CA
Something went wrong! Please refresh the page.
| Fire incidents reported | |
|---|---|
| Sreet name | Count |
| CAPITOL AVE | 462 |
| RIVER RD | 222 |
| JEFFERSON BLVD | 178 |
| SACRAMENTO AVE | 134 |
| JEFFERSON BL | 104 |
| MAPLE ST | 74 |
| CR136 | 70 |
| LIGHTHOUSE DR | 70 |
| CAPITOL AV | 68 |
| F ST | 68 |
| HARBOR BLVD | 62 |
| RICE AVE | 56 |
| 4TH ST | 54 |
| 3RD ST | 52 |
| 2ND ST | 50 |
| TOWER BRIDGE GTWY | 50 |
| LAKE WASHINGTON BLVD | 48 |
| SOUTHPORT PKY | 48 |
| US 50 | 48 |
| 5TH ST | 46 |
| C ST | 46 |
| WESTACRE RD | 46 |
| MERKLEY AVE | 44 |
| IKEA CT | 40 |
| HARBOR BL | 38 |
| TRIANGLE CT | 38 |
| POPLAR AVE | 34 |
| EVERGREEN AVE | 32 |
| RIVERBANK RD | 32 |
| RIVERPOINT CT | 32 |
| Other | 136 |
2009 - 2018 National Fire Incident Reporting System (NFIRS) incidents
- Incident types reported to NFIRS in West Sacramento, CA
- 20,29262.7%Rescue & EMS
- 3,87212.0%Good Intent Call
- 3,29110.2%Service Call
- 2,4827.7%Fire
- 1,3924.3%False Alarm
- 9963.1%Hazardous Condition
- Fire incident types reported to NFIRS in West Sacramento, CA
- 1,56463.0%Outside Fires
- 55622.4%Structure Fires
- 27110.9%Mobile Property/Vehicle Fires
- 913.7%Other
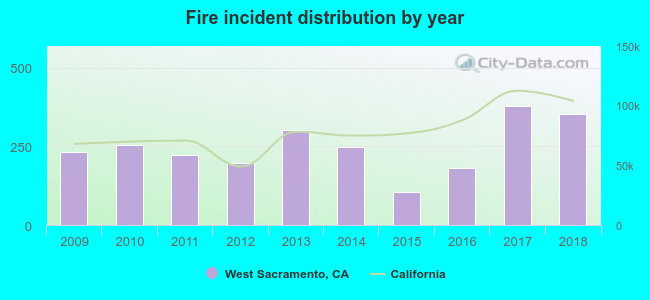 Based on the data from the years 2009 - 2018 the average number of fires per year is 248. The highest number of fires - 380 took place in 2017, and the least - 106 in 2015. The data has a growing trend.
The average number of yearly fire incidents per 10k residents in West Sacramento, CA compared to nearest cities:
(Note: Based on data for the last 3 years, including only cities with population 5,000 and above)
| West Sacramento: | 58.9 |
| Sacramento: | 69.5 |
| Florin: | 51.8 |
| Rio Linda: | 39.7 |
| Elverta: | 94.1 |
| Davis: | 12.8 |
| North Highlands: | 46.8 |
| Laguna: | 0.5 |
| Elk Grove: | 2.5 |
 The median response time based on all reported fire incidents is 5 minutes. This is lower than the California median value.
The median response time in West Sacramento, CA compared to nearest cities:
(Note: Based on data for all years, including only cities with at least 500 fire incidents)
| West Sacramento: | 5 minutes |
| Sacramento: | 5 minutes |
| Florin: | 5 minutes |
| Rio Linda: | 5 minutes |
| Elverta: | 6 minutes |
| Davis: | 6 minutes |
| North Highlands: | 5 minutes |
| Elk Grove: | 6 minutes |
| Carmichael: | 5 minutes |
 Based on the reports from the years 2009 - 2018 the average number of fire-related casualties per year is 1. The highest number of reported injuries - 3 took place in 2012, and the lowest - 0 in 2010. The data has a growing trend.
The average number of injuries per 1,000 fire incidents is 4. This indicator was the highest - 15 in 2012, and the lowest 0 in 2010. The trend for injuries per 1,000 fire incidents is decreasing. Compared to the state value the number of injuries per 1,000 fires is lower.
Based on the reports from the years 2009 - 2018 the average number of fire-related casualties per year is 1. The highest number of reported injuries - 3 took place in 2012, and the lowest - 0 in 2010. The data has a growing trend.
The average number of injuries per 1,000 fire incidents is 4. This indicator was the highest - 15 in 2012, and the lowest 0 in 2010. The trend for injuries per 1,000 fire incidents is decreasing. Compared to the state value the number of injuries per 1,000 fires is lower.Casualties per 1,000 incidents in West Sacramento, CA compared to nearest cities:
(Note: Based on data for all years, including only cities with at least 500 fire incidents)
| West Sacramento: | 4.0 |
| Sacramento: | 2.3 |
| Florin: | 3.6 |
| Rio Linda: | 1.2 |
| Elverta: | 0.0 |
| Davis: | 10.4 |
| North Highlands: | 0.0 |
| Elk Grove: | 1.0 |
| Carmichael: | 5.6 |
 34.7% incidents where reported in the morning and 65.3% in the evening. The most fires (15.5%) took place on Saturday, and the least (13.5%) on Wednesday.
 According to the 2,482 reports from years 2009 - 2018 most fires (13.9%) took place during June, and the least (5.1%) in February.
 Out of all 32,350 cases reported during the years 2009 - 2018, the most belonged to the categories: Rescue & EMS (62.7%), Good Intent Call (12.0%), and Service Call (10.2%).
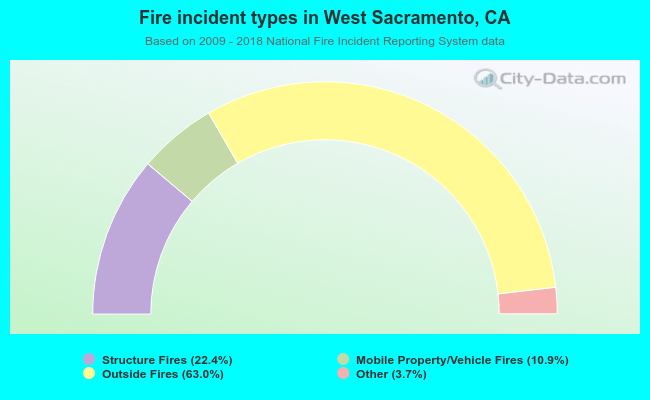 When looking into fire subcategories, the most incidents belonged to: Outside Fires (63.0%), and Structure Fires (22.4%).