| Fire incidents reported |
|---|
| Sreet name | Count |
|---|
| HIGHWAY 14 | 38 | | HIGHWAY 141 | 36 | | SNOWDEN RD | 32 | | HWY 141 | 28 | | E JEWETT BLVD | 20 | | SNOWDEN ROAD | 18 | | NW LOOP RD | 12 | | RHINE VILLAGE | 12 | | BRISLAWN RD | 10 | | ESTES ST | 10 | | WYERS ST | 10 | | EL CAMINO REAL | 8 | | HIGHWAY 141A | 8 | | JEWETT BLVD. | 8 | | NE WASHINGTON ST | 8 | | NE WISCONSIN ST | 8 | | SNOWDEN RD | 8 | | WISCONSIN ST | 8 | | BATES RD | 6 | | CHERRY VIEW LN | 6 | | CHILDS ROAD | 6 | | DILLON RIDGE RD | 6 | | EYRIE RD | 6 | | GREEN ST | 6 | | HOOD ST | 6 |
| | | Fire incidents reported |
|---|
| Sreet name | Count |
|---|
| JEWETT BLVD | 6 | | NE ESTES AV | 6 | | NE FIELD AV | 6 | | NE WAUNA AV | 6 | | NOT IDENTIFIED | 6 | | NW LINCOLN ST | 6 | | OAK ST | 6 | | PUCKER HUDDLE | 6 | | STAATS ROAD | 6 | | W JEWETT BLVD | 6 | | WAUBISH | 6 | | WNUK RD | 6 | | 14 HWY | 4 | | 8TH ST | 4 | | BATES RD | 4 | | BLACKBERRY LN | 4 | | BRISTOL ROAD | 4 | | CATHERINE CREEK RD | 4 | | COLUMBIA ST | 4 | | COUNTRY VIEW LN | 4 | | COURTNEY RD | 4 | | DILLON RIDGE ROAD | 4 | | DOCK GRADE RD | 4 | | DOCK RD | 4 | | HOOD RIVER BRIDGE | 4 |
|
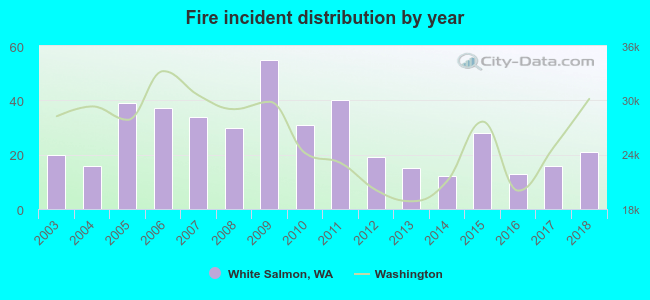 According to the data from the years 2003 - 2018 the average number of fires per year is 27. The highest number of fires - 55 took place in 2009, and the least - 12 in 2014. The data has a rising trend.
 31.7% incidents where reported in the morning and 68.3% in the evening. The most fires (16.0%) took place on Sunday, and the least (11.7%) on Tuesday.
 Based on the 426 reports from years 2003 - 2018 most fires (20.4%) took place during July, and the least (4.0%) in December.
 Out of all 1,105 cases reported during the years 2003 - 2018, the most belonged to the categories: Fire (38.6%), Rescue & EMS (24.9%), and Hazardous Condition (13.8%).
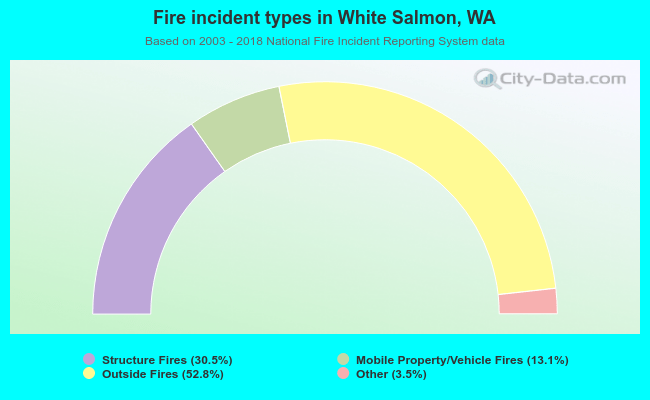 When looking into fire subcategories, the most reports belonged to: Outside Fires (52.8%), and Structure Fires (30.5%).