Woodworth: Fire Incidents, Louisiana (LA)
Where are fire incidents reported in Woodworth, LA
Something went wrong! Please refresh the page.
|
| |||||||||||||||||||||||||||||||||||||||||||||||||||||||||||||||||||||||||||||||||||||||||||||||||||||||||||||
2006 - 2018 National Fire Incident Reporting System (NFIRS) incidents
- Incident types reported to NFIRS in Woodworth, LA
- 36345.0%Rescue & EMS
- 16420.3%Fire
- 8810.9%Hazardous Condition
- 759.3%Service Call
- 658.1%False Alarm
- 303.7%Good Intent Call
- 101.2%Special Incident
- 91.1%Severe Weather
- 20.2%Overpressure Rupture
- Fire incident types reported to NFIRS in Woodworth, LA
- 10463.4%Outside Fires
- 3118.9%Structure Fires
- 2515.2%Mobile Property/Vehicle Fires
- 42.4%Other
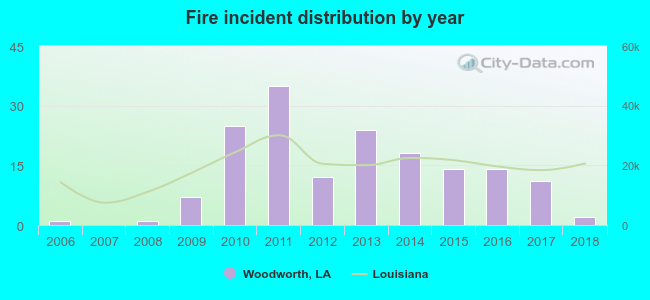 According to the data from the years 2006 - 2018 the average number of fire incidents per year is 13. The highest number of reported fire incidents - 35 took place in 2011, and the least - 0 in 2007. The data has a growing trend.
 23.8% incidents where reported in the morning and 76.2% in the evening. The most fires (22.0%) took place on Thursday, and the least (9.1%) on Sunday.
 Based on the 164 fire incidents from years 2006 - 2018 most fires (15.2%) took place during January, and the least (4.3%) in July.
 Out of all 806 cases reported during the years 2006 - 2018, the most belonged to the categories: Rescue & EMS (45.0%), Fire (20.3%), and Hazardous Condition (10.9%).
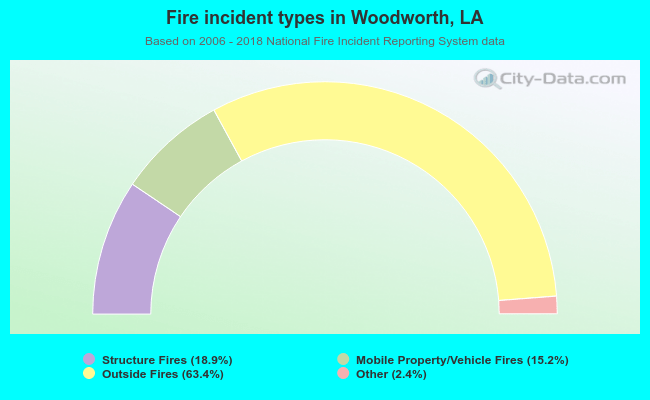 When looking into fire subcategories, the most incidents belonged to: Outside Fires (63.4%), and Structure Fires (18.9%).