Wynnewood: Fire Incidents, Oklahoma (OK)
Where are fire incidents reported in Wynnewood, OK
Something went wrong! Please refresh the page.
|
| |||||||||||||||||||||||||||||||||||||||||||||||||||||||||||||||||||||||||||||||||||||||||||||||||||||||||||||
2003 - 2018 National Fire Incident Reporting System (NFIRS) incidents
- Incident types reported to NFIRS in Wynnewood, OK
- 15690.7%Fire
- 63.5%Good Intent Call
- 42.3%Hazardous Condition
- 31.7%Rescue & EMS
- 10.6%Service Call
- 10.6%False Alarm
- 10.6%Severe Weather
- Fire incident types reported to NFIRS in Wynnewood, OK
- 12177.6%Outside Fires
- 1811.5%Structure Fires
- 117.1%Other
- 63.8%Mobile Property/Vehicle Fires
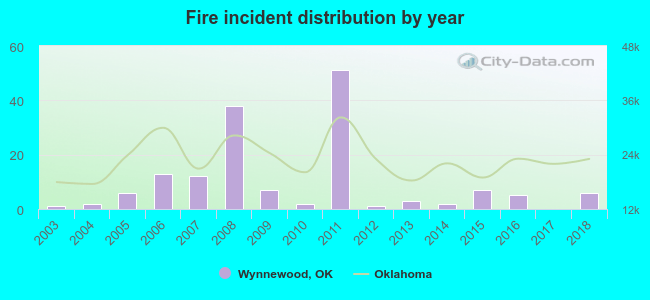 According to the data from the years 2003 - 2018 the average number of fire incidents per year is 10. The highest number of fire incidents - 51 took place in 2011, and the least - 0 in 2017. The data has a rising trend.
 23.7% incidents where reported in the morning and 76.3% in the evening. The most fires (21.2%) took place on Friday, and the least (7.1%) on Sunday.
 Based on the 156 fire incident reports from years 2003 - 2018 most fires (20.5%) took place during January, and the least (0.0%) in September.
 Out of all 172 cases reported during the years 2003 - 2018, the most belonged to the categories: Fire (90.7%), Service Call (3.5%), and Rescue & EMS (2.3%).
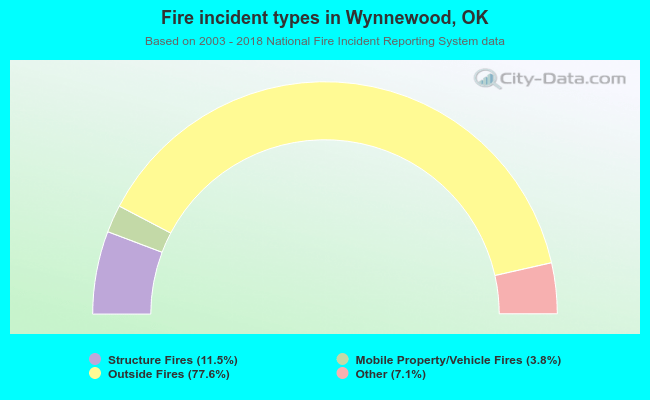 When looking into fire subcategories, the most incidents belonged to: Outside Fires (77.6%), and Structure Fires (11.5%).