Ashland, PA (Pennsylvania) Houses and Residents
| Ashland: | $63,926 |
| Pennsylvania: | $245,500 |
Mean price in 2022:
Detached houses: $124,205
Here: $124,205 State: $317,202 Townhouses or other attached units: $111,860
Here: $111,860 State: $254,369 Mobile homes: $211,104
Here: $211,104 State: $92,414
Total population: 2,757 (All urban)
Houses: 1,608 (1,152 occupied: 741 owner occupied, 436 renter occupied)
| % of renters here: | 37% |
| State: | 31% |
Housing density: 924 houses/condos per square mile
Median price asked for vacant for-sale houses and condos in 2022: $191,573.
Median contract rent in 2022: $488 (lower quartile is $382, upper quartile is $621)
Median rent asked for vacant for-rent units in 2022: $399
Median gross rent in Ashland, PA in 2022: $700
Housing units in Ashland with a mortgage: 317 (4 second mortgage, 0 home equity loan, 4 both second mortgage and home equity loan)
Houses without a mortgage: 44
Median household income for houses/condos with a mortgage: $74,261
Median household income for apartments without a mortgage: $70,478
Median monthly housing costs: $671
Compare current foreclosures near Ashland, PA:
| Photo | Address | Area | Beds / Baths | Price | Details |
|---|---|---|---|---|---|

|
#1
Walnut St
Ashland, PA 17921
|
1,512 sq. feet
|
2 baths 3 beds |
show details | |

|
#2
Shamokin St
Ashland, PA 17921
|
3,041 sq. feet
|
1 baths 3 beds |
show details | |

|
#3
Market St
Ashland, PA 17921
|
1,895 sq. feet
|
1 baths 5 beds |
show details | |

|
#4
Landers Ct
Ashland, PA 17921
|
2,082 sq. feet
|
1 baths 3 beds |
show details | |

|
#5
Airport Rd
Ashland, PA 17921
|
1,520 sq. feet
|
1 baths 3 beds |
show details | |

|
#6
Walnut St
Ashland, PA 17921
|
1,261 sq. feet
|
1 baths 3 beds |
show details | |

|
#7
Main St
Ashland, PA 17921
|
2 sq. feet
|
2 baths 5 beds |
show details | |

|
#8
Middle St
Ashland, PA 17921
|
1,137 sq. feet
|
- baths 3 beds |
show details | |

|
#9
Fountain St
Ashland, PA 17921
|
- sq. feet
|
- baths - beds |
show details | |

|
#10
Old Berwick Rd
Bloomsburg, PA 17815
|
1,264 sq. feet
|
1 baths 2 beds |
$205,000
|
show details |
| Photo | Address | Area | Beds / Baths | Price | Details |
|---|---|---|---|---|---|

|
#11
Middle St
Ashland, PA 17921
|
- sq. feet
|
- baths - beds |
show details | |

|
#12
E Saylor St
Mount Carmel, PA 17851
|
- sq. feet
|
1 baths 2 beds |
$29,900
|
show details |

|
#13
Spring St
Tremont, PA 17981
|
- sq. feet
|
1 baths 4 beds |
show details | |

|
#14
Will Ave
Barnesville, PA 18214
|
1,836 sq. feet
|
2 baths 3 beds |
show details | |

|
#15
Cherry St
Bloomsburg, PA 17815
|
1,488 sq. feet
|
1 baths 3 beds |
show details | |

|
#16
Spruce St
Kulpmont, PA 17834
|
- sq. feet
|
1 baths 3 beds |
show details | |

|
#17
Mahantongo St
Pottsville, PA 17901
|
1,792 sq. feet
|
1 baths 4 beds |
show details | |

|
#18
W Race St
Pottsville, PA 17901
|
1,872 sq. feet
|
1 baths 3 beds |
show details | |

|
#19
N Tulpehocken St
Pine Grove, PA 17963
|
600 sq. feet
|
1 baths 2 beds |
show details | |

|
#20
W Church St
Orwigsburg, PA 17961
|
1,294 sq. feet
|
1 baths 3 beds |
show details |
| Photo | Address | Area | Beds / Baths | Price | Details |
|---|---|---|---|---|---|

|
#21
W End Ave
Pottsville, PA 17901
|
1,536 sq. feet
|
2 baths 3 beds |
show details | |

|
#22
N Garfield Ave
Schuylkill Haven, PA 17972
|
904 sq. feet
|
1 baths 2 beds |
show details | |

|
#23
Gold St
Shamokin, PA 17872
|
1,400 sq. feet
|
2 baths 4 beds |
show details | |

|
#24
E Cameron St
Shamokin, PA 17872
|
1,072 sq. feet
|
1 baths 3 beds |
show details | |

|
#25
Saint Ann St
Barnesville, PA 18214
|
1,312 sq. feet
|
1 baths 3 beds |
show details | |

|
#26
E Plane St
Gordon, PA 17936
|
1,534 sq. feet
|
1 baths 3 beds |
show details | |

|
#27
W Market St
Pottsville, PA 17901
|
1,909 sq. feet
|
1 baths 5 beds |
show details | |

|
#28
Dad Burnhams Rd
Pine Grove, PA 17963
|
2,447 sq. feet
|
1 baths 4 beds |
show details | |

|
#29
W Market St
Pottsville, PA 17901
|
1,392 sq. feet
|
1 baths 3 beds |
show details | |

|
#30
E William St
Schuylkill Haven, PA 17972
|
1,160 sq. feet
|
1 baths 3 beds |
show details |
| Photo | Address | Area | Beds / Baths | Price | Details |
|---|---|---|---|---|---|

|
#31
Walnut St
Pottsville, PA 17901
|
1,296 sq. feet
|
1 baths 3 beds |
show details | |

|
#32
Buckaroo Dr
Auburn, PA 17922
|
1,650 sq. feet
|
2 baths 3 beds |
show details | |

|
#33
Cross Creek Dr
Pottsville, PA 17901
|
1,994 sq. feet
|
2 baths 4 beds |
show details | |

|
#34
W Maple St
Valley View, PA 17983
|
1,350 sq. feet
|
1 baths 3 beds |
show details | |

|
#35
S Nichols St
Saint Clair, PA 17970
|
1,350 sq. feet
|
1 baths 3 beds |
show details | |

|
#36
Wiggan St
New Philadelphia, PA 17959
|
1,008 sq. feet
|
1 baths 2 beds |
show details | |

|
#37
Marsha Dr
Cressona, PA 17929
|
1,534 sq. feet
|
2 baths 3 beds |
show details | |

|
#38
W Market St
Pottsville, PA 17901
|
3,216 sq. feet
|
3 baths 5 beds |
show details | |

|
#39
Meadow Dr
Schuylkill Haven, PA 17972
|
1,020 sq. feet
|
1 baths 3 beds |
show details | |

|
#40
Gracy Rd
Pottsville, PA 17901
|
1,152 sq. feet
|
1 baths 2 beds |
show details |
| Photo | Address | Area | Beds / Baths | Price | Details |
|---|---|---|---|---|---|

|
#41
Patton Dr
Orwigsburg, PA 17961
|
5,892 sq. feet
|
5 baths 5 beds |
show details | |

|
#42
E Liberty St
Schuylkill Haven, PA 17972
|
1,504 sq. feet
|
1 baths 2 beds |
show details | |

|
#43
Greenwood Ave
Pottsville, PA 17901
|
1,809 sq. feet
|
1 baths 4 beds |
show details | |

|
#44
Ridge Rd
Klingerstown, PA 17941
|
1,248 sq. feet
|
1 baths 3 beds |
show details | |

|
#45
E Mahanoy St
Mahanoy City, PA 17948
|
1,132 sq. feet
|
2 baths 3 beds |
show details | |

|
#46
S Margaretta St
Schuylkill Haven, PA 17972
|
1,264 sq. feet
|
1 baths 3 beds |
show details | |

|
#47
E William St
Schuylkill Haven, PA 17972
|
922 sq. feet
|
1 baths 2 beds |
show details | |

|
#48
Washington St
Tremont, PA 17981
|
1,568 sq. feet
|
1 baths 3 beds |
show details | |

|
#49
Main St
Pottsville, PA 17901
|
1,220 sq. feet
|
1 baths 3 beds |
show details | |

|
Check over 1 million property listings on Foreclosure.com!
|
browse all offers | |||

Latest news about housing in Ashland, PA collected exclusively by city-data.com from local newspapers, TV, and radio stations


Median year apartment built: 1945
Household type by relationship:
Households: 2,491- Male householders: 494 (169 living alone), Female householders: 657 (235 living alone)
394 spouses (394 opposite-sex spouses), 135 unmarried partners, (135 opposite-sex unmarried partners), 526 children (504 natural, 0 adopted, 21 stepchildren), 3 grandchildren, 37 brothers or sisters, 21 parents, 0 foster children, 0 other relatives, 216 non-relatives
Size of family households: 302 2-persons, 157 3-persons, 92 4-persons, 22 5-persons, 28 6-persons, 8 7-or-more-persons.
Size of nonfamily households: 379 1-person, 116 2-persons, 51 3-persons.
128 married couples with children.
181 single-parent households (73 men, 108 women).
97.9% of residents of Ashland speak English at home.
0.4% of residents speak Spanish at home (100% speak English very well).
0.8% of residents speak other Indo-European language at home (63% speak English very well, 37% speak English well).
| Here: | 6.9 |
| State: | 6.8 |
| Here: | 5.3 |
| State: | 4.3 |

- Bedrooms in owner-occupied houses and condos in Ashland, Pennsylvania
- 0no bedroom
- 161 bedroom
- 1302 bedrooms
- 4203 bedrooms
- 1374 bedrooms
- 395+ bedrooms

- Bedrooms in renter-occupied apartments in Ashland, Pennsylvania
- 4no bedroom
- 1691 bedroom
- 1032 bedrooms
- 1073 bedrooms
- 454 bedrooms
- 85+ bedrooms

- Cars and other vehicles available in Ashland in owner-occupied houses/condos
- 86no vehicle
- 1821 vehicle
- 3652 vehicles
- 1033 vehicles
- 64 vehicles
- 05+ vehicles

- Cars and other vehicles available in Ashland in renter-occupied apartments
- 160no vehicle
- 2451 vehicle
- 312 vehicles
- 03 vehicles
- 04 vehicles
- 05+ vehicles

- Rooms in owner-occupied houses in Ashland, Pennsylvania
- 01 room
- 02 rooms
- 03 rooms
- 464 rooms
- 845 rooms
- 2036 rooms
- 1367 rooms
- 788 rooms
- 1959+ rooms

- Rooms in renter-occupied apartments in Ashland, Pennsylvania
- 01 room
- 82 rooms
- 1073 rooms
- 724 rooms
- 1085 rooms
- 546 rooms
- 187 rooms
- 608 rooms
- 89+ rooms


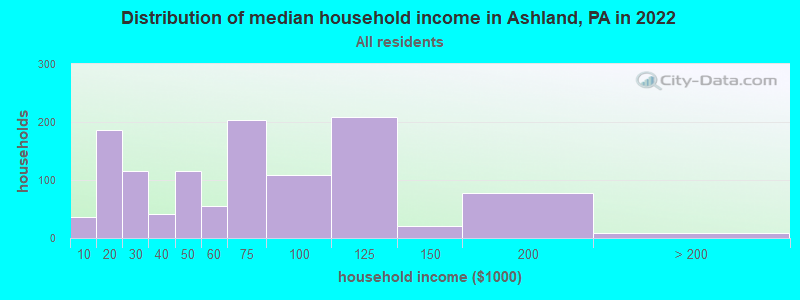
Ashland, PA household income distribution

- 36Less than $10,000
- 186$10,000 to $19,999
- 116$20,000 to $29,999
- 41$30,000 to $39,999
- 116$40,000 to $49,999
- 56$50,000 to $59,999
- 203$60,000 to $74,999
- 108$75,000 to $99,999
- 208$100,000 to $124,999
- 21$125,000 to $149,999
- 78$150,000 to $199,999
- 8$200,000 or more
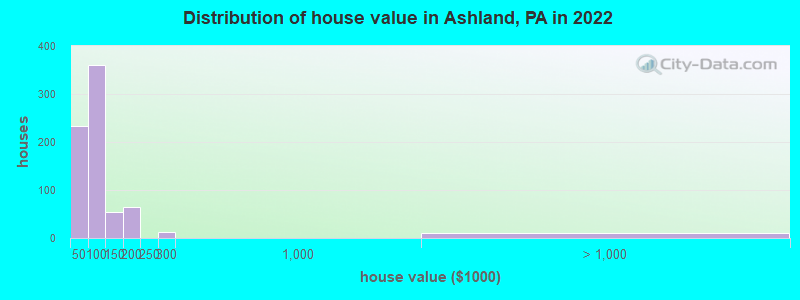
Home value of owner - occupied houses in 2022 in Ashland, PA
-
- 22Less than $10,000
- 5$10,000 to $14,999
- 52$20,000 to $24,999
- 3$25,000 to $29,999
- 10$30,000 to $34,999
- 44$35,000 to $39,999
- 93$40,000 to $49,999
- 55$50,000 to $59,999
- 55$60,000 to $69,999
- 73$70,000 to $79,999
- 31$80,000 to $89,999
- 51$90,000 to $99,999
- 12$100,000 to $124,999
- 41$125,000 to $149,999
- 52$150,000 to $174,999
- 11$175,000 to $199,999
- 11$250,000 to $299,999
- 10$1,500,000 to $1,999,999
Rent paid by renters in 2022 in Ashland, PA
-
- 35$200 to $249
- 10$250 to $299
- 48$300 to $349
- 55$350 to $399
- 41$450 to $499
- 26$500 to $549
- 38$550 to $599
- 98$600 to $649
- 2$650 to $699
- 4$800 to $899
- 39$900 to $999
- 27No cash rent


Percentage of workers working in this county: 80.3%
Number of people working at home: 0 (0.0% of all workers)
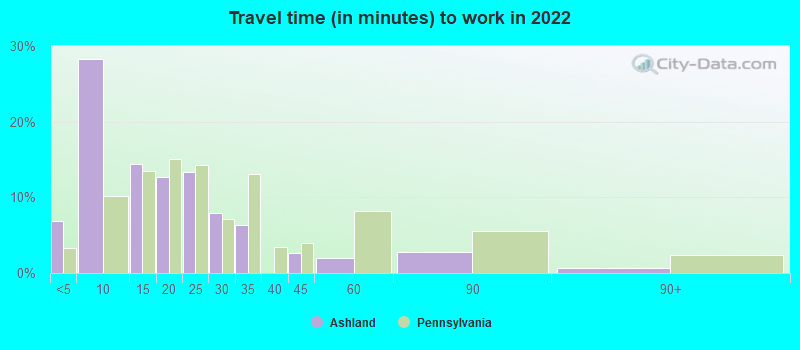
Travel time to work (commute)
- Less than 5 minutes: 33
- 5 to 9 minutes: 106
- 10 to 14 minutes: 80
- 15 to 19 minutes: 233
- 20 to 24 minutes: 134
- 25 to 29 minutes: 204
- 30 to 34 minutes: 141
- 35 to 39 minutes: 58
- 40 to 44 minutes: 32
- 45 to 59 minutes: 21
- 60 to 89 minutes: 11
- 90 or more minutes: 68
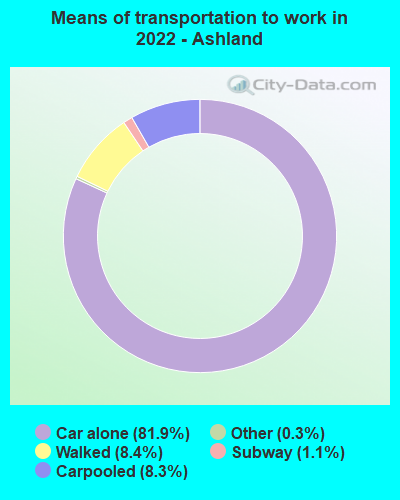
Means of transportation to work:
- Drove a car alone: 698 (80.7%)
- Carpooled: 77 (8.9%)
- Long-distance train or commuter rail: 6 (0.7%)
- Taxi: 1 (0.1%)
- Walked: 60 (6.9%)

- Unemployment by race in 2022
- Unemployment rate for White non-Hispanic residents
- 5.3%Males
- Unemployment rate for Black residents
- 84.5%Males

- Year of entry for the foreign-born population in Ashland, Pennsylvania
- 01995 to March 2000
- 01990 to 1994
- 01985 to 1989
- 61980 to 1984
- 01975 to 1979
- 01970 to 1974
- 01965 to 1969
- 0Before 1965

First ancestries reported:
- Irish: 366 (35.0%)
- German: 327 (31.3%)
- Italian: 104 (10.0%)
- Polish: 58 (5.6%)
- American: 53 (5.1%)
- Lithuanian: 38 (3.6%)
- English: 20 (1.9%)
- Scottish: 19 (1.8%)
- Dutch: 12 (1.1%)
- Pennsylvania German: 10 (1.0%)
- European: 7 (0.7%)
- Russian: 7 (0.7%)
Most common places of birth for foreign-born residents (%):
| Ashland: | 100.0% (6) |
| Pennsylvania: | 5.3% (26,703) |
Place of birth for U.S.-born residents:
- This state: 2,293
- Other state: 160
- Northeast: 120
- Midwest: 0
- South: 41
- West: 0
88.2% of Ashland residents lived in the same house 1 years ago.
Out of people who lived in different houses, 47.5% lived in this county.
Out of people who lived in different counties, 21.7% lived in Pennsylvania.
| Ashland: | 88.2% |
| State average: | 89.3% |
Education attainment for males 25 years and older:
- No schooling: 45
- Nursery to 4th grade: 0
- 5th and 6th grade: 0
- 7th and 8th grade: 6
- 9th grade: 0
- 10th grade: 6
- 11th grade: 4
- 12th grade, no diploma: 0
- High school graduate (or equivalency): 461
- Less than 1 year of college: 0
- Some college more than 1 year, no degree: 118
- Associate degree: 50
- Bachelor's degree: 65
- Master's degree: 35
- Professional school degree: 6
- Doctorate degree: 0

Education attainment for females 25 years and older:
- No schooling: 25
- Nursery to 4th grade: 0
- 5th and 6th grade: 0
- 7th and 8th grade: 30
- 9th grade: 42
- 10th grade: 41
- 11th grade: 41
- 12th grade, no diploma: 20
- High school graduate (or equivalency): 429
- Less than 1 year of college: 107
- Some college more than 1 year, no degree: 67
- Associate degree: 62
- Bachelor's degree: 40
- Master's degree: 83
- Professional school degree: 0
- Doctorate degree: 0


Housing units in structures:
- One, detached: 441
- One, attached: 880
- Two: 49
- 3 or 4: 75
- 5 to 9: 59
- 20 to 49: 37
- 50 or more: 23
- Mobile homes: 37
Housing units lacking complete kitchen facilities in 2022: 11.0%
House/condo owner moved in on average 16 years ago
Renter moved in on average 3 years ago

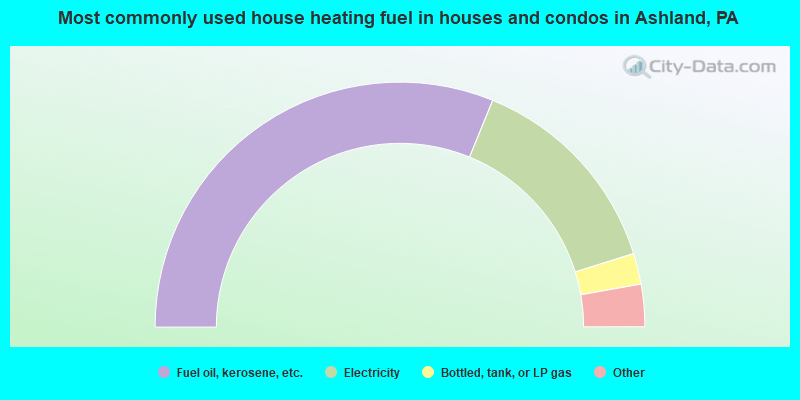
- 62.5%Fuel oil, kerosene, etc.
- 28.0%Electricity
- 4.1%Bottled, tank, or LP gas
- 3.7%Utility gas
- 1.7%Coal or coke
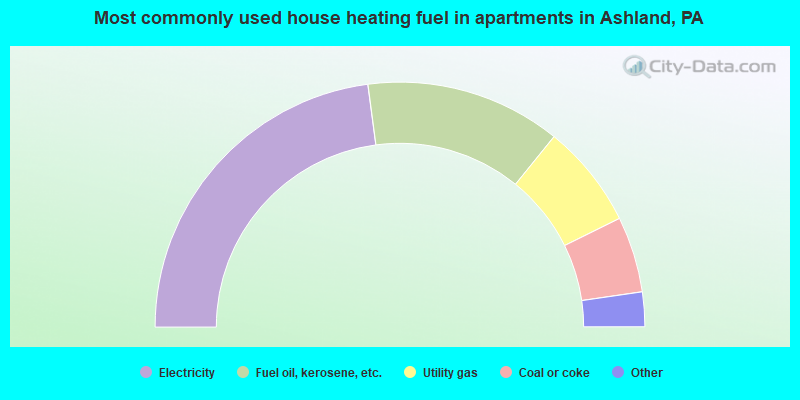
- 46.1%Electricity
- 26.0%Fuel oil, kerosene, etc.
- 13.8%Utility gas
- 10.1%Coal or coke
- 3.3%Wood
- 0.7%Bottled, tank, or LP gas
Private vs. public school enrollment:
| Here: | 0.0% |
| Pennsylvania: | 15.7% |
| Here: | 0.0% |
| Pennsylvania: | 13.4% |
| Here: | 26.0% |
| Pennsylvania: | 39.8% |


