Beaverdale-Lloydell, PA (Pennsylvania) Houses and Residents
| Beaverdale-Lloydell: | $68,007 |
| Pennsylvania: | $245,500 |
Total population: 1,171 (Urban population: 0, Rural population: 1,212 (all nonfarm))
Houses: 556 (497 occupied: 404 owner occupied, 93 renter occupied)
| % of renters here: | 19% |
| State: | 31% |
Housing density: 413 houses/condos per square mile
Median price asked for vacant for-sale houses and condos in 2022 in this county: $90,499.
Median contract rent in 2022: $418 (lower quartile is $265, upper quartile is $467)
Median rent asked for vacant for-rent units in 2022: $439
Median gross rent in Beaverdale-Lloydell, PA in 2022: $639
Housing units in Beaverdale-Lloydell with a mortgage: 173 (8 second mortgage, 12 home equity loan, 0 both second mortgage and home equity loan)
Houses without a mortgage: 198


Household type by relationship:
Households: 135,587- In family households: 111,166 (27,891 male householders, 9,944 female householders)
28,671 spouses, 36,751 children (34,496 natural, 705 adopted, 1,550 stepchildren), 2,283 grandchildren, 984 brothers or sisters, 959 parents, foster children, 713 other relatives, 2,451 non-relatives
- In nonfamily households: 24,421 (9,295 male householders (7,754 living alone)), 11,820 female householders (10,636 living alone)), 3,306 nonrelatives
- In group quarters: 8,092 (4,373 institutionalized population)
22,926 married couples with children.
6,665 single-parent households (1,580 men, 5,085 women).
98.7% of residents of Beaverdale-Lloydell speak English at home.
0.3% of residents speak Spanish at home (100% speak English very well).
1.0% of residents speak other Indo-European language at home (100% speak English very well).
| Here: | 6.9 |
| State: | 6.8 |
| Here: | 5.9 |
| State: | 4.3 |

- Bedrooms in owner-occupied houses and condos in Beaverdale-Lloydell, Pennsylvania
- 0no bedroom
- 41 bedroom
- 802 bedrooms
- 2343 bedrooms
- 674 bedrooms
- 195+ bedrooms

- Bedrooms in renter-occupied apartments in Beaverdale-Lloydell, Pennsylvania
- 0no bedroom
- 81 bedroom
- 292 bedrooms
- 383 bedrooms
- 134 bedrooms
- 55+ bedrooms

- Cars and other vehicles available in Beaverdale-Lloydell in owner-occupied houses/condos
- 34no vehicle
- 1511 vehicle
- 1352 vehicles
- 553 vehicles
- 214 vehicles
- 85+ vehicles

- Cars and other vehicles available in Beaverdale-Lloydell in renter-occupied apartments
- 3no vehicle
- 651 vehicle
- 252 vehicles
- 03 vehicles
- 04 vehicles
- 05+ vehicles

- Rooms in owner-occupied houses in Beaverdale-Lloydell, Pennsylvania
- 01 room
- 02 rooms
- 43 rooms
- 354 rooms
- 755 rooms
- 1236 rooms
- 657 rooms
- 578 rooms
- 459+ rooms

- Rooms in renter-occupied apartments in Beaverdale-Lloydell, Pennsylvania
- 01 room
- 02 rooms
- 43 rooms
- 174 rooms
- 305 rooms
- 276 rooms
- 157 rooms
- 08 rooms
- 09+ rooms


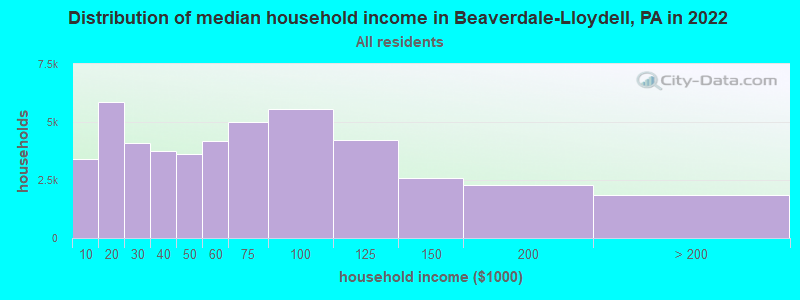
Beaverdale-Lloydell, PA household income distribution

- 3,415Less than $10,000
- 5,858$10,000 to $19,999
- 4,096$20,000 to $29,999
- 3,735$30,000 to $39,999
- 3,617$40,000 to $49,999
- 4,178$50,000 to $59,999
- 5,019$60,000 to $74,999
- 5,575$75,000 to $99,999
- 4,206$100,000 to $124,999
- 2,596$125,000 to $149,999
- 2,269$150,000 to $199,999
- 1,870$200,000 or more
Percentage of workers working in this county: 80.0%
Number of people working at home: 45 (11.0% of all workers)
Travel time to work (commute)
- Less than 5 minutes: 37
- 5 to 9 minutes: 41
- 10 to 14 minutes: 65
- 15 to 19 minutes: 30
- 20 to 24 minutes: 77
- 25 to 29 minutes: 68
- 30 to 34 minutes: 66
- 35 to 39 minutes: 0
- 40 to 44 minutes: 4
- 45 to 59 minutes: 23
- 60 to 89 minutes: 3
- 90 or more minutes: 14
Means of transportation to work:
- Drove a car alone: 351 (77.8%)
- Carpooled: 43 (9.5%)
- Walked: 34 (7.5%)
- Worked at home: 23 (5.1%)


First ancestries reported:
- German: 352 (28.0%)
- Other: 120 (9.6%)
- English: 117 (9.3%)
- Slovak: 105 (8.4%)
- United States: 91 (7.3%)
- Polish: 86 (6.9%)
- Irish: 76 (6.1%)
- Italian: 74 (5.9%)
- Scotch-Irish: 48 (3.8%)
- Swedish: 30 (2.4%)
- French: 28 (2.2%)
- Dutch: 26 (2.1%)
- Hungarian: 23 (1.8%)
- Russian: 19 (1.5%)
- Czech: 16 (1.3%)
- Scottish: 16 (1.3%)
- Ukrainian: 11 (0.9%)
- Norwegian: 5 (0.4%)
- Swiss: 5 (0.4%)
- Lithuanian: 4 (0.3%)
- French Canadian: 3 (0.2%)
Place of birth for U.S.-born residents:
- This state: 1,106
- Other state: 106
- Northeast: 13
- Midwest: 26
- South: 67
- West: 0
74% of Beaverdale-Lloydell residents lived in the same house 5 years ago.
Out of people who lived in different houses, 88% lived in this county.
Out of people who lived in different counties, 61% lived in Pennsylvania.
Education attainment for males 25 years and older:
- No schooling: 6
- Nursery to 4th grade: 0
- 5th and 6th grade: 0
- 7th and 8th grade: 8
- 9th grade: 14
- 10th grade: 20
- 11th grade: 25
- 12th grade, no diploma: 15
- High school graduate (or equivalency): 215
- Less than 1 year of college: 36
- Some college more than 1 year, no degree: 19
- Associate degree: 5
- Bachelor's degree: 7
- Master's degree: 4
- Professional school degree: 5
- Doctorate degree: 5

Education attainment for females 25 years and older:
- No schooling: 5
- Nursery to 4th grade: 0
- 5th and 6th grade: 0
- 7th and 8th grade: 49
- 9th grade: 22
- 10th grade: 17
- 11th grade: 11
- 12th grade, no diploma: 7
- High school graduate (or equivalency): 231
- Less than 1 year of college: 22
- Some college more than 1 year, no degree: 11
- Associate degree: 22
- Bachelor's degree: 21
- Master's degree: 13
- Professional school degree: 10
- Doctorate degree: 0


Housing units in structures:
- One, detached: 431
- One, attached: 55
- Two: 31
- 3 or 4: 15
- Mobile homes: 24
Median worth of mobile homes: $18,491
Housing units lacking complete kitchen facilities: 0.7%

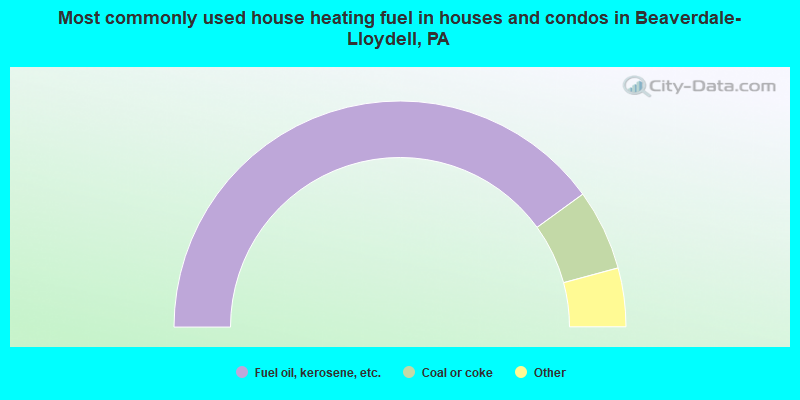
- 80.0%Fuel oil, kerosene, etc.
- 11.6%Coal or coke
- 4.0%Electricity
- 3.2%Wood
- 1.2%Utility gas
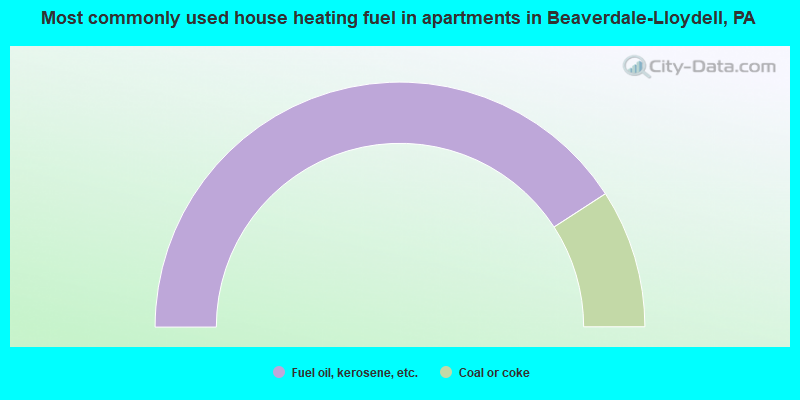
- 81.7%Fuel oil, kerosene, etc.
- 18.3%Coal or coke
Private vs. public school enrollment:
| Here: | 4.2% |
| Pennsylvania: | 16.0% |
| Here: | 0.0% |
| Pennsylvania: | 13.1% |
| Here: | 21.7% |
| Pennsylvania: | 37.3% |


