Bellbrook, OH (Ohio) Houses and Residents
| Bellbrook: | $258,375 |
| Ohio: | $204,100 |
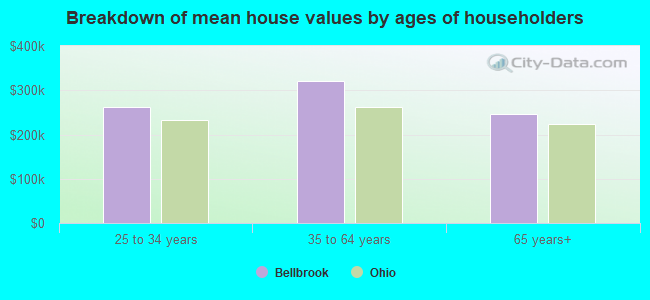
Mean price in 2022:
Detached houses: $282,146
Here: $282,146 State: $254,366 Townhouses or other attached units: $249,925
Here: $249,925 State: $225,733
Total population: 7,031 (All urban)
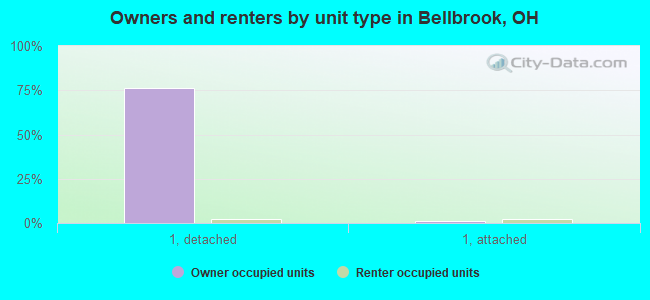
Houses: 3,163 (3,151 occupied: 2,353 owner occupied, 741 renter occupied)
| % of renters here: | 24% |
| State: | 33% |
Housing density: 1,013 houses/condos per square mile
Median price asked for vacant for-sale houses and condos in 2022 in this county: $104,780.
Median contract rent in 2022: $1,002 (lower quartile is $870, upper quartile is $1,184)
Median rent asked for vacant for-rent units in 2022: $998
Median gross rent in Bellbrook, OH in 2022: $1,123
Housing units in Bellbrook with a mortgage: 1,635 (423 second mortgage, 22 home equity loan, 392 both second mortgage and home equity loan)
Houses without a mortgage: 153
Median household income for houses/condos with a mortgage: $133,035
Median household income for apartments without a mortgage: $102,265
Median monthly housing costs: $1,258
Compare current foreclosures near Bellbrook, OH:
| Photo | Address | Area | Beds / Baths | Price | Details |
|---|---|---|---|---|---|

|
#1
W Maple St
Bellbrook, OH 45305
|
1,081 sq. feet
|
1 baths 3 beds |
show details | |

|
#2
Ravinia Dr
Bellbrook, OH 45305
|
3,519 sq. feet
|
4 baths 4 beds |
show details | |

|
#3
Washington Mill Rd
Bellbrook, OH 45305
|
1,284 sq. feet
|
2 baths 2 beds |
show details | |

|
#4
Spillway Dr
Bellbrook, OH 45305
|
3,242 sq. feet
|
3 baths 4 beds |
show details | |

|
#5
Hess Rd
Bellbrook, OH 45305
|
1,050 sq. feet
|
1 baths 2 beds |
show details | |

|
#6
Kensington Dr
Bellbrook, OH 45305
|
2,222 sq. feet
|
2 baths 3 beds |
show details | |

|
#7
Lower Hillside Dr
Bellbrook, OH 45305
|
1,312 sq. feet
|
1 baths 3 beds |
show details | |

|
#8
Graf Mill Rd
Bellbrook, OH 45305
|
1,620 sq. feet
|
1 baths 3 beds |
show details | |

|
#9
Little Sugarcreek Rd
Bellbrook, OH 45305
|
1,075 sq. feet
|
1 baths 3 beds |
show details | |

|
#10
Marcia Dr
Bellbrook, OH 45305
|
1,653 sq. feet
|
2 baths 3 beds |
show details |
| Photo | Address | Area | Beds / Baths | Price | Details |
|---|---|---|---|---|---|

|
#11
Mill Run Ln
Bellbrook, OH 45305
|
- sq. feet
|
- baths - beds |
show details | |

|
#12
Arlene Ave
Dayton, OH 45406
|
1,044 sq. feet
|
1 baths 3 beds |
$42,500
|
show details |

|
#13
Carlisle Ave
Dayton, OH 45420
|
1,615 sq. feet
|
1 baths 3 beds |
$204,500
|
show details |

|
#14
813 Ferndale Ave
Dayton, OH 45406
|
- sq. feet
|
2 baths 6 beds |
$103,950
|
show details |

|
#15
Alexandersville Bell
Dayton, OH 45449
|
1,669 sq. feet
|
2 baths 3 beds |
$125,000
|
show details |

|
#16
Sparks St
Dayton, OH 45426
|
1,100 sq. feet
|
1 baths 3 beds |
$159,900
|
show details |

|
#17
S Linda Dr
Bellbrook, OH 45305
|
- sq. feet
|
- baths - beds |
show details | |

|
#18
Hawker St
Dayton, OH 45410
|
- sq. feet
|
3 baths 3 beds |
$31,500
|
show details |

|
#19
Lee Ct
Fairborn, OH 45324
|
1,040 sq. feet
|
1 baths 3 beds |
show details | |

|
#20
Stanview Ave
Dayton, OH 45404
|
1,964 sq. feet
|
2 baths 4 beds |
show details |
| Photo | Address | Area | Beds / Baths | Price | Details |
|---|---|---|---|---|---|

|
#21
Grove Ave
Dayton, OH 45404
|
1,118 sq. feet
|
1 baths 2 beds |
show details | |

|
#22
Dickey Ave
Fairborn, OH 45324
|
960 sq. feet
|
2 baths 3 beds |
show details | |

|
#23
W Riverview Ave
Dayton, OH 45405
|
1,117 sq. feet
|
3 baths 2 beds |
show details | |

|
#24
W 2nd St
Dayton, OH 45402
|
1,784 sq. feet
|
1 baths 3 beds |
show details | |

|
#25
Boxwood Dr
Fairborn, OH 45324
|
1,134 sq. feet
|
2 baths 3 beds |
show details | |

|
#26
Old State Route 122
Waynesville, OH 45068
|
1,512 sq. feet
|
2 baths 3 beds |
show details | |

|
#27
Old Winchester Trl
Xenia, OH 45385
|
1,650 sq. feet
|
3 baths 3 beds |
show details | |

|
#28
Pennyroyal Rd
Franklin, OH 45005
|
1,918 sq. feet
|
1 baths 4 beds |
show details | |

|
#29
Boyd Rd
Xenia, OH 45385
|
1,176 sq. feet
|
3 baths 3 beds |
show details | |

|
#30
Riley Wills Rd
Lebanon, OH 45036
|
1,628 sq. feet
|
2 baths 3 beds |
show details |
| Photo | Address | Area | Beds / Baths | Price | Details |
|---|---|---|---|---|---|

|
#31
Suttman St
Miamisburg, OH 45342
|
2,336 sq. feet
|
2 baths 3 beds |
show details | |

|
#32
Buckeye St
Miamisburg, OH 45342
|
1,549 sq. feet
|
1 baths 2 beds |
show details | |

|
#33
Bickmore Ave
Dayton, OH 45404
|
728 sq. feet
|
1 baths 2 beds |
show details | |

|
#34
Lee Ct
Fairborn, OH 45324
|
1,040 sq. feet
|
1 baths 3 beds |
show details | |

|
#35
Rosewood Dr
Springboro, OH 45066
|
1,380 sq. feet
|
1 baths 3 beds |
show details | |

|
#36
Shannon St
Dayton, OH 45402
|
1,078 sq. feet
|
1 baths 2 beds |
show details | |

|
#37
E Church St
Xenia, OH 45385
|
1,131 sq. feet
|
1 baths 3 beds |
show details | |

|
#38
Cambridge Dr
Springboro, OH 45066
|
2,152 sq. feet
|
3 baths 4 beds |
show details | |

|
#39
S Heincke Rd
Miamisburg, OH 45342
|
864 sq. feet
|
1 baths 2 beds |
show details | |

|
#40
E 2nd St
Dayton, OH 45403
|
908 sq. feet
|
2 baths 2 beds |
show details |
| Photo | Address | Area | Beds / Baths | Price | Details |
|---|---|---|---|---|---|

|
#41
Fairway Dr
Springboro, OH 45066
|
1,199 sq. feet
|
2 baths 3 beds |
show details | |

|
#42
E 2nd St
Dayton, OH 45403
|
1,646 sq. feet
|
1 baths 3 beds |
show details | |

|
#43
E Main St
Xenia, OH 45385
|
912 sq. feet
|
1 baths 2 beds |
show details | |

|
#44
Rangeley Ave
Dayton, OH 45403
|
998 sq. feet
|
2 baths 4 beds |
show details | |

|
#45
Blue Bell Rd
Dayton, OH 45431
|
988 sq. feet
|
1 baths 3 beds |
show details | |

|
#46
Mound St
Dayton, OH 45402
|
1,726 sq. feet
|
2 baths 4 beds |
show details | |

|
#47
Fairpark Ave
Dayton, OH 45431
|
1,152 sq. feet
|
1 baths 3 beds |
show details | |

|
#48
Graham Dr
Springboro, OH 45066
|
1,073 sq. feet
|
2 baths 3 beds |
show details | |

|
#49
N 11th St
Miamisburg, OH 45342
|
898 sq. feet
|
1 baths 2 beds |
show details | |

|
Check over 1 million property listings on Foreclosure.com!
|
browse all offers | |||

Latest news about housing in Bellbrook, OH collected exclusively by city-data.com from local newspapers, TV, and radio stations

 | Tell me more about Dayton, Xenia, Beavercreek, and Centerville, please! (74 replies) |
| Relocating from FL, need to find rental homes (24 replies) |
| Military first home buyer: Can you rent a $300K home? (12 replies) |
| Bellbrook Property Taxes - High Variability By Year (3 replies) |
| Home Buying Stats Clayton\Englewood (24 replies) |
| Moving to Ohio and considering Dayton (32 replies) |

Median year apartment built: 1994
Household type by relationship:
Households: 7,359- Male householders: 1,743 (418 living alone), Female householders: 1,380 (327 living alone)
1,957 spouses (1,954 opposite-sex spouses), 106 unmarried partners, (98 opposite-sex unmarried partners), 1,912 children (1,881 natural, 0 adopted, 30 stepchildren), 33 grandchildren, 47 brothers or sisters, 25 parents, 0 foster children, 9 other relatives, 145 non-relatives
Size of family households: 876 2-persons, 654 3-persons, 498 4-persons, 32 5-persons, 43 6-persons.
Size of nonfamily households: 847 1-person, 152 2-persons, 35 3-persons.
1,201 married couples with children.
176 single-parent households (0 men, 176 women).
95.3% of residents of Bellbrook speak English at home.
0.4% of residents speak Spanish at home (100% speak English very well).
0.7% of residents speak other Indo-European language at home (76% speak English very well, 24% speak English not well).
3.1% of residents speak Asian or Pacific Island language at home (78% speak English very well, 22% speak English well).
Foreign born population: 307 (4.2%)
(13.4% of them are naturalized citizens)
| Here: | 7.7 |
| State: | 6.7 |
| Here: | 4.4 |
| State: | 4.4 |
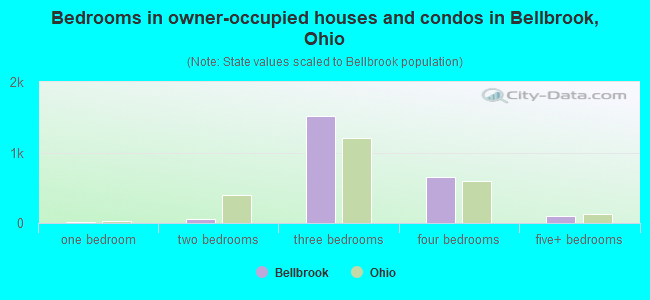
- Bedrooms in owner-occupied houses and condos in Bellbrook, Ohio
- 0no bedroom
- 141 bedroom
- 612 bedrooms
- 1,5203 bedrooms
- 6564 bedrooms
- 1035+ bedrooms
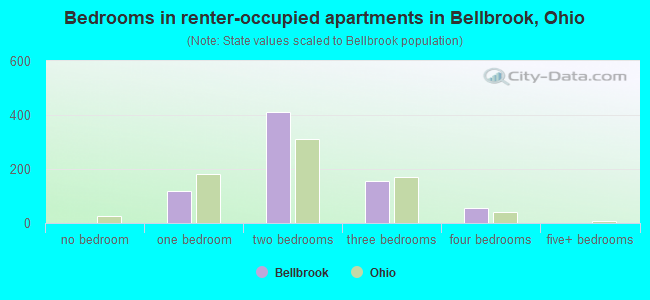
- Bedrooms in renter-occupied apartments in Bellbrook, Ohio
- 0no bedroom
- 1181 bedroom
- 4112 bedrooms
- 1573 bedrooms
- 554 bedrooms
- 05+ bedrooms
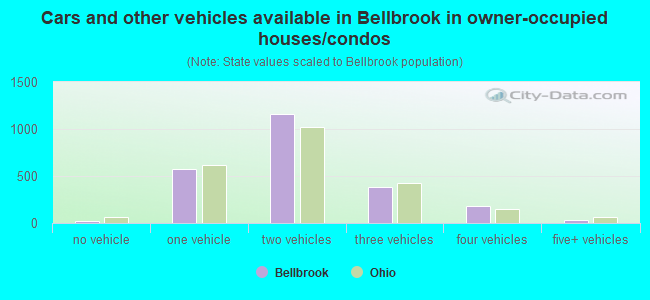
- Cars and other vehicles available in Bellbrook in owner-occupied houses/condos
- 17no vehicle
- 5751 vehicle
- 1,1602 vehicles
- 3873 vehicles
- 1844 vehicles
- 325+ vehicles
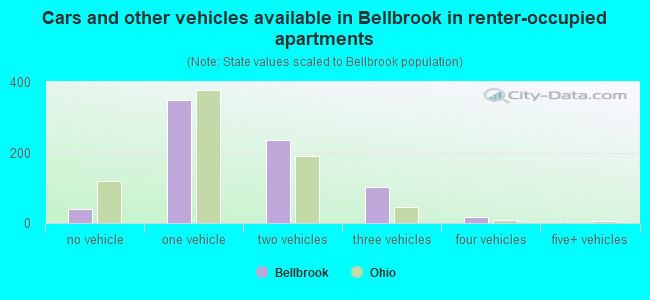
- Cars and other vehicles available in Bellbrook in renter-occupied apartments
- 41no vehicle
- 3481 vehicle
- 2362 vehicles
- 1013 vehicles
- 164 vehicles
- 05+ vehicles
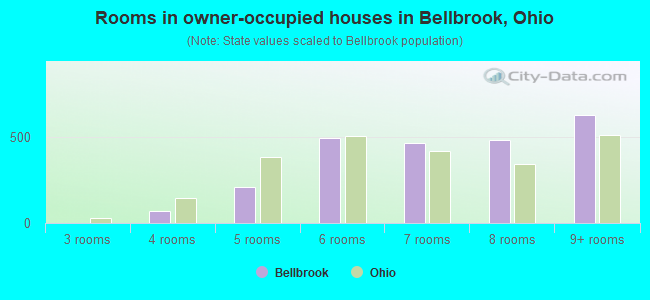
- Rooms in owner-occupied houses in Bellbrook, Ohio
- 01 room
- 02 rooms
- 03 rooms
- 704 rooms
- 2075 rooms
- 4966 rooms
- 4677 rooms
- 4848 rooms
- 6309+ rooms
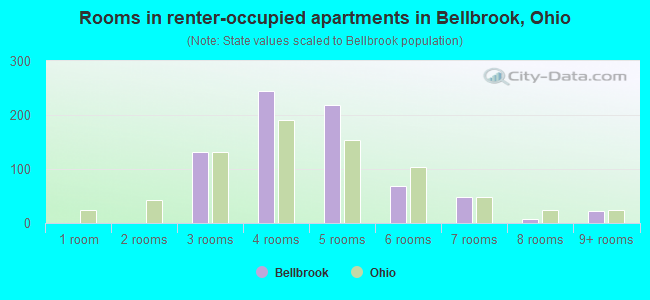
- Rooms in renter-occupied apartments in Bellbrook, Ohio
- 01 room
- 02 rooms
- 1313 rooms
- 2444 rooms
- 2185 rooms
- 696 rooms
- 487 rooms
- 88 rooms
- 239+ rooms
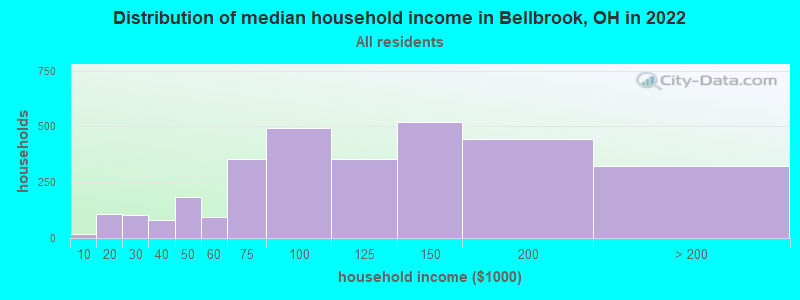
Bellbrook, OH household income distribution

- 19Less than $10,000
- 109$10,000 to $19,999
- 104$20,000 to $29,999
- 79$30,000 to $39,999
- 186$40,000 to $49,999
- 92$50,000 to $59,999
- 354$60,000 to $74,999
- 495$75,000 to $99,999
- 354$100,000 to $124,999
- 520$125,000 to $149,999
- 446$150,000 to $199,999
- 325$200,000 or more
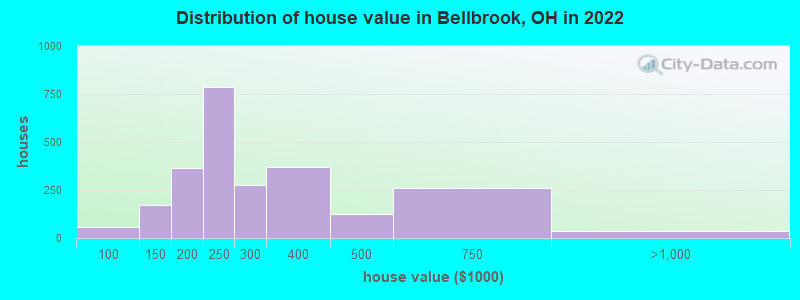
Home value of owner - occupied houses in 2022 in Bellbrook, OH
-
- 20$60,000 to $69,999
- 10$70,000 to $79,999
- 4$80,000 to $89,999
- 21$90,000 to $99,999
- 77$100,000 to $124,999
- 92$125,000 to $149,999
- 168$150,000 to $174,999
- 198$175,000 to $199,999
- 785$200,000 to $249,999
- 277$250,000 to $299,999
- 369$300,000 to $399,999
- 124$400,000 to $499,999
- 262$500,000 to $749,999
- 36$750,000 to $999,999
Rent paid by renters in 2022 in Bellbrook, OH
-
- 73$600 to $649
- 41$650 to $699
- 15$700 to $749
- 77$800 to $899
- 190$900 to $999
- 236$1,000 to $1,249
- 91$1,250 to $1,499
- 14$1,500 to $1,999
- 7$2,500 to $2,999
- 19No cash rent
Percentage of workers working in this county: 43.7%
Number of people working at home: 701 (18.3% of all workers)

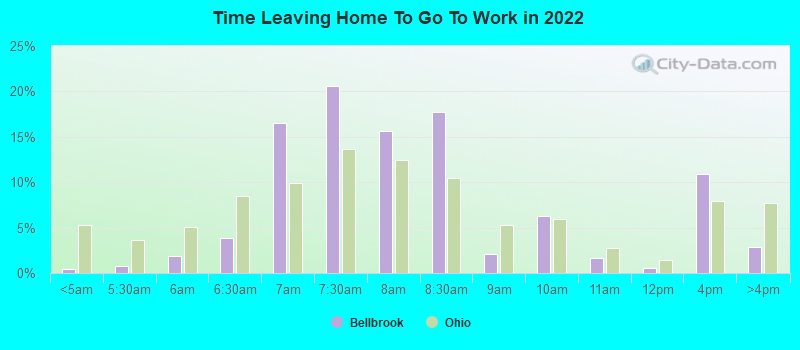
Travel time to work (commute)
- Less than 5 minutes: 94
- 5 to 9 minutes: 196
- 10 to 14 minutes: 363
- 15 to 19 minutes: 527
- 20 to 24 minutes: 528
- 25 to 29 minutes: 678
- 30 to 34 minutes: 349
- 35 to 39 minutes: 65
- 40 to 44 minutes: 104
- 45 to 59 minutes: 281
- 60 to 89 minutes: 89
- 90 or more minutes: 0
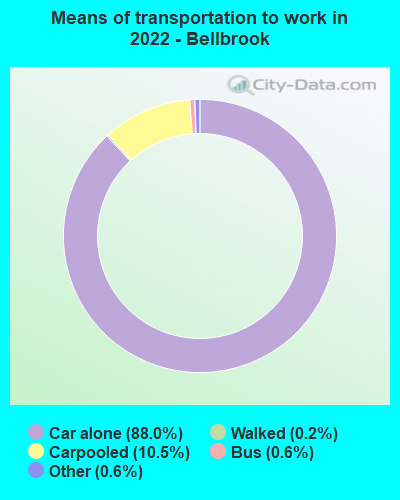
Means of transportation to work:
- Drove a car alone: 1,434 (64.3%)
- Carpooled: 184 (8.2%)
- Bus: 8 (0.4%)
- Taxi: 11 (0.5%)
- Walked: 3 (0.1%)
- Worked at home: 701 (31.4%)
- Unemployment by race in 2022
- Unemployment rate for White non-Hispanic residents
- 0.9%Males
- 0.5%Females
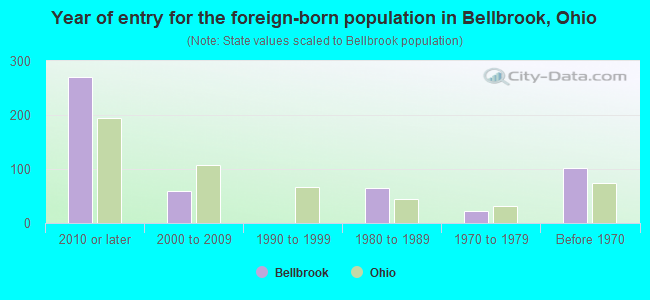
- Year of entry for the foreign-born population in Bellbrook, Ohio
- 2702010 or later
- 592000 to 2009
- 01990 to 1999
- 651980 to 1989
- 231970 to 1979
- 102Before 1970
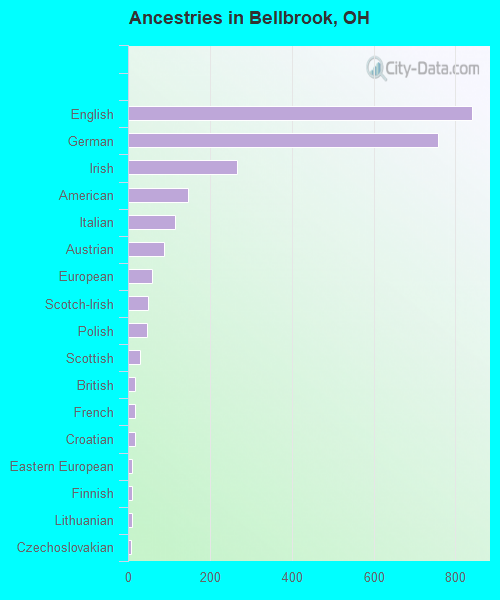
First ancestries reported:
- English: 840 (28.9%)
- German: 757 (26.1%)
- Irish: 267 (9.2%)
- American: 147 (5.1%)
- Italian: 114 (3.9%)
- Austrian: 88 (3.0%)
- European: 59 (2.0%)
- Scotch-Irish: 49 (1.7%)
- Polish: 46 (1.6%)
- Scottish: 30 (1.0%)
- British: 18 (0.6%)
- French: 18 (0.6%)
- Croatian: 16 (0.6%)
- Eastern European: 9 (0.3%)
- Finnish: 9 (0.3%)
- Lithuanian: 9 (0.3%)
- Czechoslovakian: 8 (0.3%)
- Syrian: 7 (0.2%)
Most common places of birth for foreign-born residents (%):
| Bellbrook: | 63.9% (221) |
| Ohio: | 11.6% (66,525) |
| Bellbrook: | 9.8% (34) |
| Ohio: | 1.0% (5,979) |
| Bellbrook: | 6.1% (21) |
| Ohio: | 1.4% (8,101) |
| Bellbrook: | 4.9% (17) |
| Ohio: | 2.6% (14,988) |
| Bellbrook: | 3.5% (12) |
| Ohio: | 0.6% (3,223) |
| Bellbrook: | 2.3% (8) |
| Ohio: | 1.9% (10,960) |
Place of birth for U.S.-born residents:
- This state: 5,071
- Other state: 1,944
- Northeast: 555
- Midwest: 424
- South: 617
- West: 334
88.7% of Bellbrook residents lived in the same house 1 years ago.
Out of people who lived in different houses, 39.6% lived in this county.
Out of people who lived in different counties, 91.5% lived in Ohio.
| Bellbrook: | 88.7% |
| State average: | 87.8% |
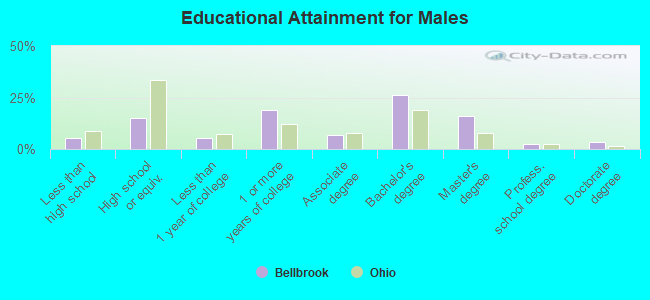
Education attainment for males 25 years and older:
- No schooling: 96
- Nursery to 4th grade: 0
- 5th and 6th grade: 0
- 7th and 8th grade: 0
- 9th grade: 25
- 10th grade: 0
- 11th grade: 0
- 12th grade, no diploma: 20
- High school graduate (or equivalency): 414
- Less than 1 year of college: 139
- Some college more than 1 year, no degree: 519
- Associate degree: 187
- Bachelor's degree: 713
- Master's degree: 440
- Professional school degree: 64
- Doctorate degree: 92
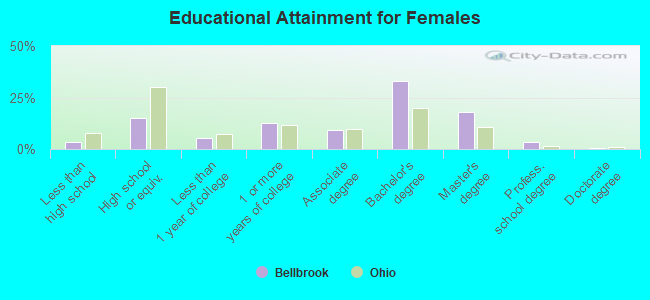
Education attainment for females 25 years and older:
- No schooling: 0
- Nursery to 4th grade: 0
- 5th and 6th grade: 0
- 7th and 8th grade: 0
- 9th grade: 64
- 10th grade: 26
- 11th grade: 0
- 12th grade, no diploma: 0
- High school graduate (or equivalency): 420
- Less than 1 year of college: 148
- Some college more than 1 year, no degree: 353
- Associate degree: 253
- Bachelor's degree: 925
- Master's degree: 506
- Professional school degree: 90
- Doctorate degree: 12


Housing units in structures:
- One, detached: 2,491
- One, attached: 140
- Two: 53
- 3 or 4: 310
- 5 to 9: 109
- 10 to 19: 56
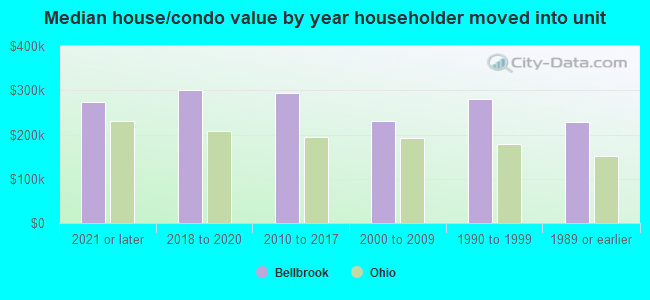
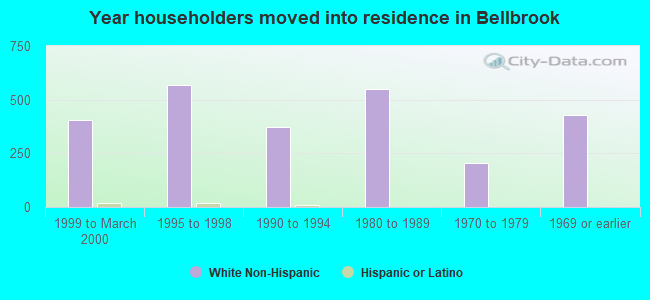
House/condo owner moved in on average 14 years ago
Renter moved in on average 1 years ago
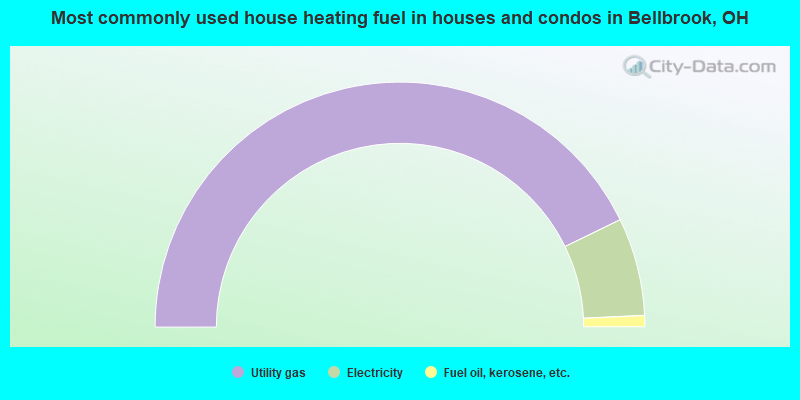
- 85.5%Utility gas
- 12.9%Electricity
- 1.5%Fuel oil, kerosene, etc.
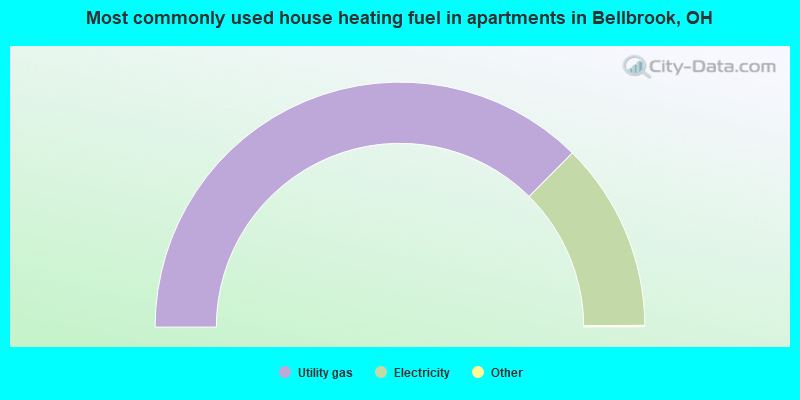
- 75.0%Utility gas
- 25.0%Electricity
Private vs. public school enrollment:
| Here: | 0.0% |
| Ohio: | 16.0% |
| Here: | 0.0% |
| Ohio: | 13.1% |
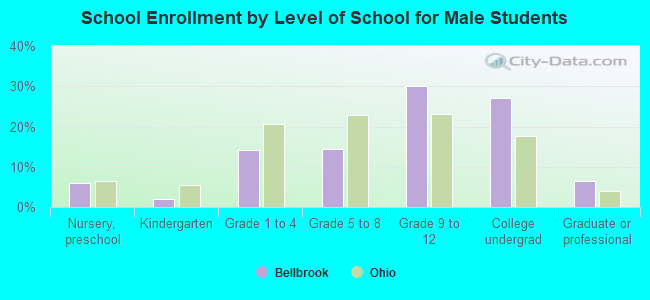
| Here: | 40.8% |
| Ohio: | 22.3% |