Bellingham, WA (Washington) Houses and Residents
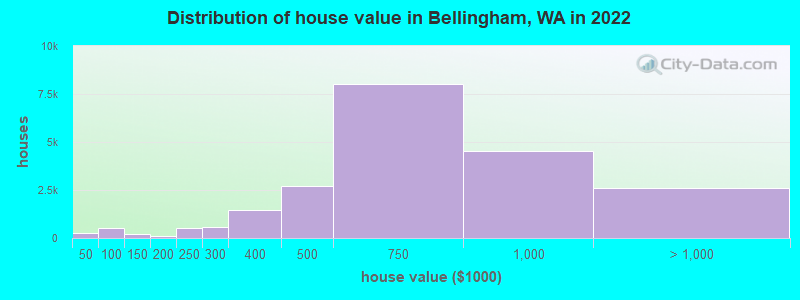
Estimated median house or condo value in 2022: $609,100 (it was $148,900 in 2000 )
Bellingham:
$609,100Washington:
$569,500
Lower value quartile - upper value quartile: $414,700 - $810,300Mean price in 2022: Detached houses: $750,600 Here:
$750,600State:
$734,307
Townhouses or other attached units: $509,248 Here:
$509,248State:
$657,697
In 2-unit structures: $663,885 Here:
$663,885State:
$534,634
In 3-to-4-unit structures: $309,441 Here:
$309,441State:
$510,239
In 5-or-more-unit structures: $365,700 Here:
$365,700State:
$503,183
Mobile homes: $181,654 Here:
$181,654State:
$218,362
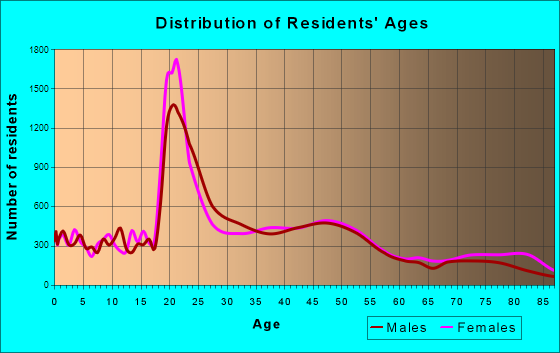
Total population: 83,365 (Urban population: 66,470, Rural population: 345 (all nonfarm) )
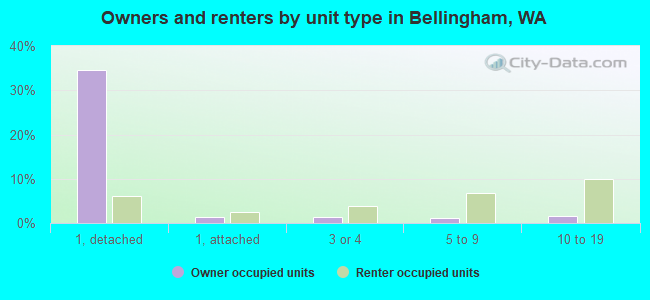
Houses: 43,973 (41,746 occupied: 18,615 owner occupied, 23,131 renter occupied )
% of renters here:
55%State:
36%
Housing density: 1,715 houses/condos per square mile
Median price asked for vacant for-sale houses and condos in 2022: $535,658.
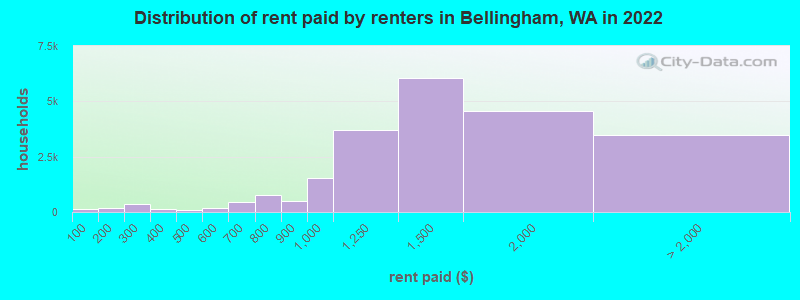
Median contract rent in 2022: $1,372 (lower quartile is $1,104, upper quartile is $1,720)
Median rent asked for vacant for-rent units in 2022: $1,602
Median gross rent in Bellingham, WA in 2022: $1,424
Housing units in Bellingham with a mortgage: 12,251 (1,355 second mortgage, 0 home equity loan, 1,169 both second mortgage and home equity loan )Houses without a mortgage: 153
Median household income for houses/condos with a mortgage: $113,863
Median household income for apartments without a mortgage: $72,500
Median monthly housing costs: $1,434
Data:
Median house or condo value ($)
Median house or condo value ($ change since 2000)
Median house or condo value ($) - White
Median house or condo value ($) - Black or African American
Median house or condo value ($) - Asian
Median house or condo value ($) - Hispanic or Latino
Median house or condo value ($) - American Indian and Alaska Native
Median house or condo value ($) - Multirace
Median house or condo value ($) - Other Race
Median price asked for mobile homes ($)
Household density (households per square mile)
Mean house or condo value by units in structure - 1, detached ($)
Mean house or condo value by units in structure - 1, attached ($)
Mean house or condo value by units in structure - 2 ($)
Mean house or condo value by units in structure by units in structure - 3 or 4 ($)
Mean house or condo value by units in structure - 5 or more ($)
Mean house or condo value by units in structure - Boat, RV, van, etc. ($)
Mean house or condo value by units in structure - Mobile home ($)
Median contract rent ($)
Median contract rent - Lower quartile ($)
Median contract rent - Upper quartile ($)
Median gross rent ($)
Urban houses (%)
Rural houses (%)
Houses occupied (%)
Houses occupied (% change since 2000)
Houses owner occupied (%)
Houses owner occupied (% change since 2000)
Houses renter occupied (%)
Houses renter occupied (% change since 2000)
Vacant housing units - For rent (%)
Vacant housing units - For rent (% change since 2000)
Vacant housing units - For sale only (%)
Vacant housing units - For sale only (% change since 2000)
Vacant housing units - Rented or sold, not occupied (%)
Vacant housing units - Rented or sold, not occupied (% change since 2000)
Vacant housing units - For seasonal, recreational, or occasional use (%)
Vacant housing units - For seasonal, recreational, or occasional use (% change since 2000)
Vacant housing units - For migrant workers (%)
Vacant housing units - For migrant workers (% change since 2000)
Vacant housing units - Other vacant (%)
Vacant housing units - Other vacant (% change since 2000)
Median monthly housing costs ($)
Median household income for houses/condos with a mortgage ($)
Median household income for houses/condos without a mortgage ($)
Median household income ($)
Median household income ($) - White
Median household income ($) - Black or African American
Median household income ($) - Asian
Median household income ($) - Hispanic or Latino
Median household income ($) - American Indian and Alaska Native
Median household income ($) - Multirace
Median household income ($) - Other Race
Mortgage status - with mortgage (%)
Mortgage status - with second mortgage (%)
Mortgage status - with home equity loan (%)
Mortgage status - with both second mortgage and home equity loan (%)
Mortgage status - without a mortgage (%)
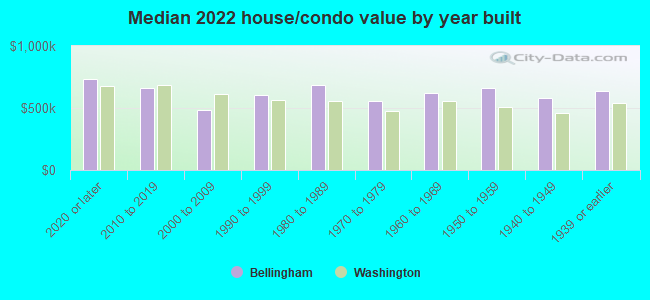
Median year house/condo built
Median year apartment built
Household type by relationship - Male householder living alone (%)
Household type by relationship - Male householder not living alone (%)
Household type by relationship - Female householder living alone (%)
Household type by relationship - Female householder not living alone (%)
Household type by relationship - Opposite-Sex spouse (%)
Household type by relationship - Same-Sex spouse (%)
Household type by relationship - Opposite-Sex unmarried partner (%)
Household type by relationship - Same-Sex unmarried partner (%)
Household type by relationship - In group quarters (%)
Size of family households - 2-person household (%)
Size of family households - 3-person household (%)
Size of family households - 4-person household (%)
Size of family households - 5-person household (%)
Size of family households - 6-person household (%)
Size of family households - 7-or-more-person household (%)
Size of nonfamily households - 1-person household (%)
Size of nonfamily households - 2-person household (%)
Size of nonfamily households - 3-person household (%)
Size of nonfamily households - 4-person household (%)
Size of nonfamily households - 5-person household (%)
Size of nonfamily households - 6-person household (%)
Size of nonfamily households - 7-or-moreperson household (%)
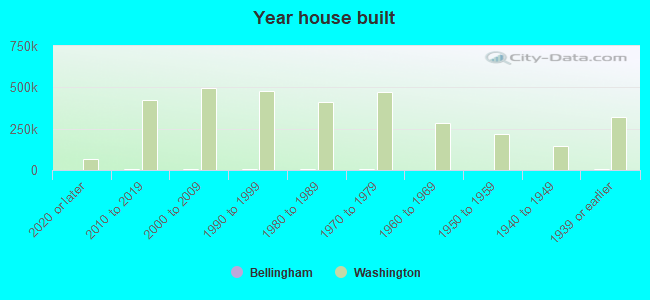
Year house built - Built 2010 or later (%)
Year house built - Built 2000 to 2009 (%)
Year house built - Built 1990 to 1999 (%)
Year house built - Built 1980 to 1989 (%)
Year house built - Built 1970 to 1979 (%)
Year house built - Built 1960 to 1969 (%)
Year house built - Built 1950 to 1959 (%)
Year house built - Built 1940 to 1949 (%)
Year house built - Built 1939 or earlier (%)
Median number of rooms in houses and condos
Median number of rooms in apartments
Median number of bedrooms in owner occupied houses
Mean number of bedrooms in owner occupied houses
Median number of bedrooms in renter occupied houses
Mean number of bedrooms in renter occupied houses
Median number of vehichles in owner occupied houses
Mean number of vehichles in owner occupied houses
Median number of vehichles in renter occupied houses
Mean number of vehichles in renter occupied houses
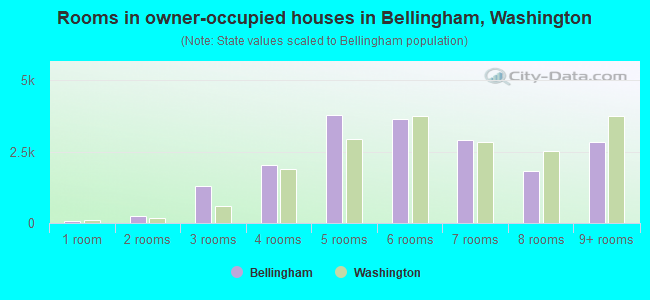
Rooms in owner-occupied houses - 1 room (%)
Rooms in owner-occupied houses - 2 rooms (%)
Rooms in owner-occupied houses - 3 rooms (%)
Rooms in owner-occupied houses - 4 rooms (%)
Rooms in owner-occupied houses - 5 rooms (%)
Rooms in owner-occupied houses - 6 rooms (%)
Rooms in owner-occupied houses - 7 rooms (%)
Rooms in owner-occupied houses - 8 rooms (%)
Rooms in owner-occupied houses - 9+ rooms (%)
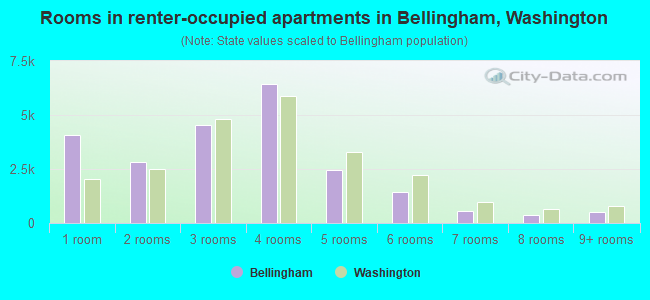
Rooms in renter-occupied houses - 1 room (%)
Rooms in renter-occupied houses - 2 rooms (%)
Rooms in renter-occupied houses - 3 rooms (%)
Rooms in renter-occupied houses - 4 rooms (%)
Rooms in renter-occupied houses - 5 rooms (%)
Rooms in renter-occupied houses - 6 rooms (%)
Rooms in renter-occupied houses - 7 rooms (%)
Rooms in renter-occupied houses - 8 rooms (%)
Rooms in renter-occupied houses - 9+ rooms (%)
Bedrooms in owner-occupied houses - no bedrooms (%)
Bedrooms in owner-occupied houses - 1 bedroom (%)
Bedrooms in owner-occupied houses - 2 bedrooms (%)
Bedrooms in owner-occupied houses - 3 bedrooms (%)
Bedrooms in owner-occupied houses - 4 bedrooms (%)
Bedrooms in owner-occupied houses - 5+ bedrooms (%)
Bedrooms in renter-occupied houses - no bedrooms (%)
Bedrooms in renter-occupied houses - 1 bedroom (%)
Bedrooms in renter-occupied houses - 2 bedrooms (%)
Bedrooms in renter-occupied houses - 3 bedrooms (%)
Bedrooms in renter-occupied houses - 4 bedrooms (%)
Bedrooms in renter-occupied houses - 5+ bedrooms (%)
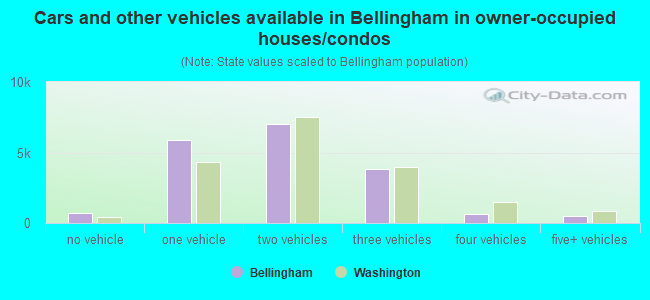
Vehicles available in owner-occupied houses - no vehicle available (%)
Vehicles available in owner-occupied houses - 1 vehicle available(%)
Vehicles available in owner-occupied houses - 2 Vehicles available (%)
Vehicles available in owner-occupied houses - 3 Vehicles available (%)
Vehicles available in owner-occupied houses - 4 Vehicles available (%)
Vehicles available in owner-occupied houses - 5+ Vehicles available (%)
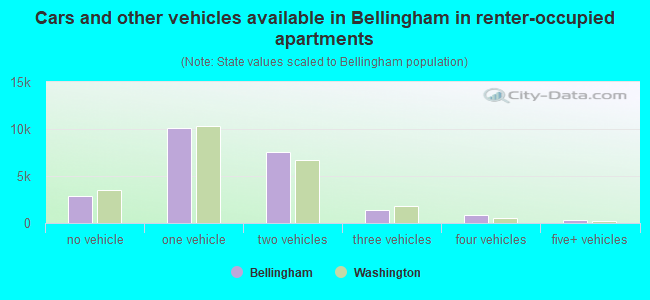
Vehicles available in renter-occupied houses - no vehicle available (%)
Vehicles available in renter-occupied houses - 1 vehicle available (%)
Vehicles available in renter-occupied houses - 2 Vehicles available (%)
Vehicles available in renter-occupied houses - 3 Vehicles available (%)
Vehicles available in renter-occupied houses - 4 Vehicles available (%)
Vehicles available in renter-occupied houses - 5+ Vehicles available (%)
Housing units in structures - 1, detached (%)
Housing units in structures - 1, attached (%)
Housing units in structures - 2 (%)
Housing units in structures - 3 or 4 (%)
Housing units in structures - 5 to 9 (%)
Housing units in structures - 10 to 19 (%)
Housing units in structures - 20 to 49 (%)
Housing units in structures - 50 or more (%)
Housing units in structures - Mobile home (%)
Housing units in structures - Boat, RV, van, etc. (%)
Housing units in structures - Owners - 1, detached (%)
Housing units in structures - Owners - 1, attached (%)
Housing units in structures - Owners - 2 (%)
Housing units in structures - Owners - 3 or 4 (%)
Housing units in structures - Owners - 5 to 9 (%)
Housing units in structures - Owners - 10 to 19 (%)
Housing units in structures - Owners - 20 to 49 (%)
Housing units in structures - Owners - 50 or more (%)
Housing units in structures - Owners - Mobile home (%)
Housing units in structures - Owners - Boat, RV, van, etc. (%)
Housing units in structures - Renters - 1, detached (%)
Housing units in structures - Renters - 1, attached (%)
Housing units in structures - Renters - 2 (%)
Housing units in structures - Renters - 3 or 4 (%)
Housing units in structures - Renters - 5 to 9 (%)
Housing units in structures - Renters - 10 to 19 (%)
Housing units in structures - Renters - 20 to 49 (%)
Housing units in structures - Renters - 50 or more (%)
Housing units in structures - Renters - Mobile home (%)
Housing units in structures - Renters - Boat, RV, van, etc. (%)
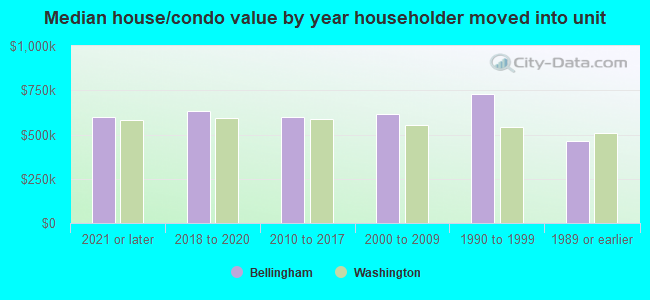
House/condo owner moved in on average (years ago)
Renter moved in on average (years ago)
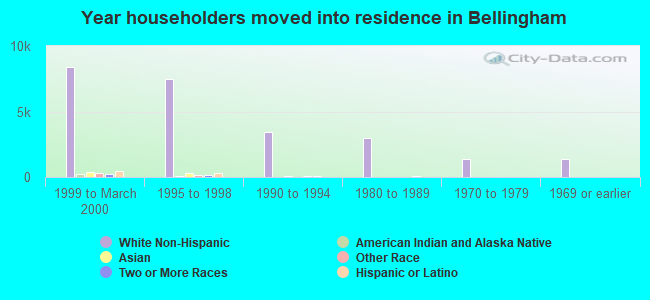
Year householder moved into unit - Moved in 1999 to March 2000 (%)
Year householder moved into unit - Moved in 1999 to March 2000 (%) - White
Year householder moved into unit - Moved in 1999 to March 2000 (%) - Black or African American
Year householder moved into unit - Moved in 1999 to March 2000 (%) - Asian
Year householder moved into unit - Moved in 1999 to March 2000 (%) - Hispanic or Latino
Year householder moved into unit - Moved in 1999 to March 2000 (%) - American Indian and Alaska Native
Year householder moved into unit - Moved in 1999 to March 2000 (%) - Multirace
Year householder moved into unit - Moved in 1999 to March 2000 (%) - Other Race
Year householder moved into unit - Moved in 1995 to 1998 (%)
Year householder moved into unit - Moved in 1995 to 1998 (%) - White
Year householder moved into unit - Moved in 1995 to 1998 (%) - Black or African American
Year householder moved into unit - Moved in 1995 to 1998 (%) - Asian
Year householder moved into unit - Moved in 1995 to 1998 (%) - Hispanic or Latino
Year householder moved into unit - Moved in 1995 to 1998 (%) - American Indian and Alaska Native
Year householder moved into unit - Moved in 1995 to 1998 (%) - Multirace
Year householder moved into unit - Moved in 1995 to 1998 (%) - Other Race
Year householder moved into unit - Moved in 1990 to 1994 (%)
Year householder moved into unit - Moved in 1990 to 1994 (%) - White
Year householder moved into unit - Moved in 1990 to 1994 (%) - Black or African American
Year householder moved into unit - Moved in 1990 to 1994 (%) - Asian
Year householder moved into unit - Moved in 1990 to 1994 (%) - Hispanic or Latino
Year householder moved into unit - Moved in 1990 to 1994 (%) - American Indian and Alaska Native
Year householder moved into unit - Moved in 1990 to 1994 (%) - Multirace
Year householder moved into unit - Moved in 1990 to 1994 (%) - Other Race
Year householder moved into unit - Moved in 1980 to 1989 (%)
Year householder moved into unit - Moved in 1980 to 1989 (%) - White
Year householder moved into unit - Moved in 1980 to 1989 (%) - Black or African American
Year householder moved into unit - Moved in 1980 to 1989 (%) - Asian
Year householder moved into unit - Moved in 1980 to 1989 (%) - Hispanic or Latino
Year householder moved into unit - Moved in 1980 to 1989 (%) - American Indian and Alaska Native
Year householder moved into unit - Moved in 1980 to 1989 (%) - Multirace
Year householder moved into unit - Moved in 1980 to 1989 (%) - Other Race
Year householder moved into unit - Moved in 1970 to 1979 (%)
Year householder moved into unit - Moved in 1970 to 1979 (%) - White
Year householder moved into unit - Moved in 1970 to 1979 (%) - Black or African American
Year householder moved into unit - Moved in 1970 to 1979 (%) - Asian
Year householder moved into unit - Moved in 1970 to 1979 (%) - Hispanic or Latino
Year householder moved into unit - Moved in 1970 to 1979 (%) - American Indian and Alaska Native
Year householder moved into unit - Moved in 1970 to 1979 (%) - Multirace
Year householder moved into unit - Moved in 1970 to 1979 (%) - Other Race
Year householder moved into unit - Moved in 1969 or earlier (%)
Year householder moved into unit - Moved in 1969 or earlier (%) - White
Year householder moved into unit - Moved in 1969 or earlier (%) - Black or African American
Year householder moved into unit - Moved in 1969 or earlier (%) - Asian
Year householder moved into unit - Moved in 1969 or earlier (%) - Hispanic or Latino
Year householder moved into unit - Moved in 1969 or earlier (%) - American Indian and Alaska Native
Year householder moved into unit - Moved in 1969 or earlier (%) - Multirace
Year householder moved into unit - Moved in 1969 or earlier (%) - Other Race
Housing units lacking complete plumbing facilities (%)
Housing units lacking complete kitchen facilities (%)
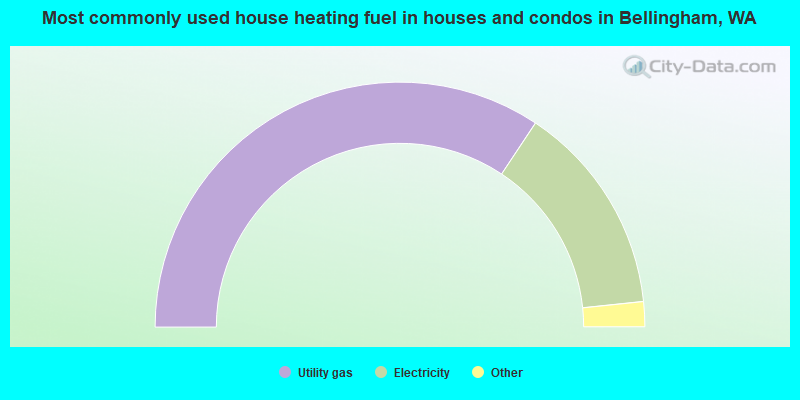
House heating fuel used in houses and condos - Utility gas (%)
House heating fuel used in houses and condos - Bottled, tank, or LP gas (%)
House heating fuel used in houses and condos - Electricity (%)
House heating fuel used in houses and condos - Fuel oil, kerosene, etc. (%)
House heating fuel used in houses and condos - Coal or coke (%)
House heating fuel used in houses and condos - Wood (%)
House heating fuel used in houses and condos - Solar energy (%)
House heating fuel used in houses and condos - Other fuel (%)
House heating fuel used in houses and condos - No fuel used (%)
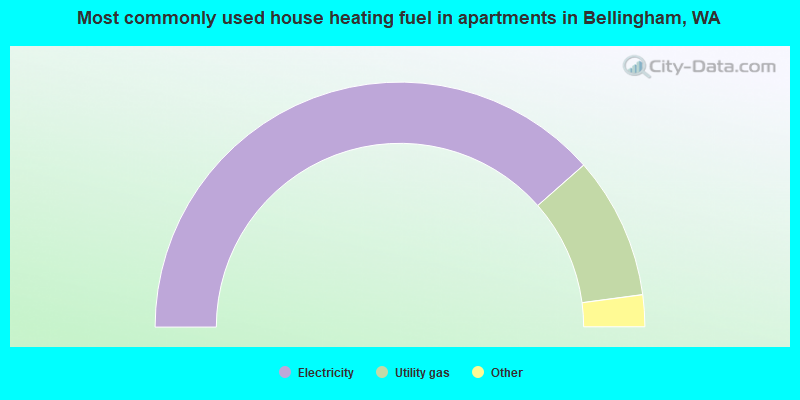
House heating fuel used in apartments - Utility gas (%)
House heating fuel used in apartments - Bottled, tank, or LP gas (%)
House heating fuel used in apartments - Electricity (%)
House heating fuel used in apartments - Fuel oil, kerosene, etc. (%)
House heating fuel used in apartments - Coal or coke (%)
House heating fuel used in apartments - Wood (%)
House heating fuel used in apartments - Solar energy (%)
House heating fuel used in apartments - Other fuel (%)
House heating fuel used in apartments - No fuel used (%)
Latest news about housing in Bellingham, WA collected exclusively by city-data.com from local newspapers, TV, and radio stations
Median year house/condo built: 1980Median year apartment built: 1996Household type by relationship:
Households: 93,899
Male householders: 19,983 (7,489 living alone ), Female householders: 21,763 (8,274 living alone )14,308 spouses (14,021 opposite-sex spouses ), 4,505 unmarried partners , (3,883 opposite-sex unmarried partners ), 17,524 children (16,962 natural , 214 adopted , 348 stepchildren ), 768 grandchildren , 311 brothers or sisters , 377 parents , 0 foster children , 329 other relatives , 9,900 non-relatives In group quarters: 4,131
Size of family households: 8,465 2-persons , 4,199 3-persons , 2,331 4-persons , 1,135 5-persons , 926 6-persons , 312 7-or-more-persons .
Size of nonfamily households: 15,763 1-person , 6,503 2-persons , 1,435 3-persons , 408 4-persons , 81 5-persons , 188 7-or-more-persons .
7,901 married couples with children. single-parent households (589 men , 2,578 women ).
87.6% of residents of Bellingham speak English at home. of residents speak Spanish at home (67% speak English very well , 21% speak English well , 11% speak English not well , 1% don't speak English at all ).of residents speak other Indo-European language at home (81% speak English very well , 12% speak English well , 7% speak English not well ).of residents speak Asian or Pacific Island language at home (67% speak English very well , 18% speak English well , 13% speak English not well , 3% don't speak English at all ).of residents speak other language at home (84% speak English very well , 6% speak English well , 3% speak English not well , 7% don't speak English at all ).
Foreign born population: 10,124 (10.8%)of them are naturalized citizens )
Median number of rooms in houses and condos:
Median number of rooms in apartments
Owner-occupied Renter-occupied
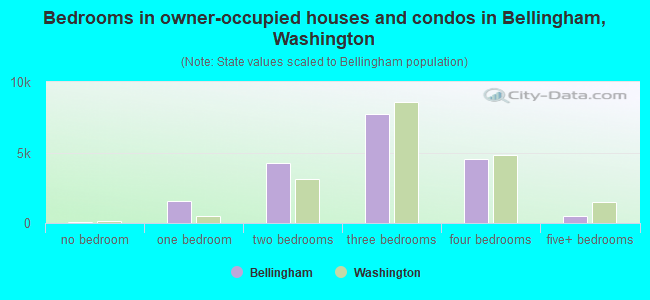
Bedrooms in owner-occupied houses and condos in Bellingham, Washington
55 no bedroom 1,586 1 bedroom 4,290 2 bedrooms 7,713 3 bedrooms 4,506 4 bedrooms 465 5+ bedrooms
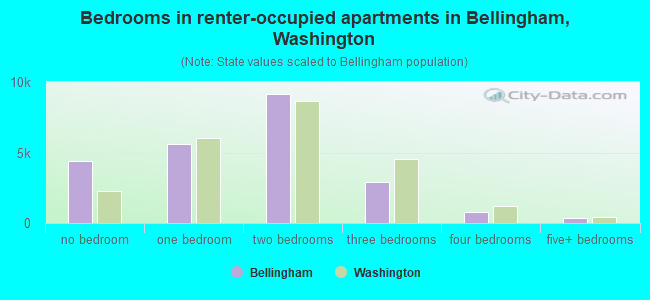
Bedrooms in renter-occupied apartments in Bellingham, Washington
4,399 no bedroom 5,581 1 bedroom 9,120 2 bedrooms 2,888 3 bedrooms 813 4 bedrooms 330 5+ bedrooms
Owner-occupied Renter-occupied
Rooms in owner-occupied houses in Bellingham, Washington
55 1 room 253 2 rooms 1,294 3 rooms 2,027 4 rooms 3,787 5 rooms 3,647 6 rooms 2,900 7 rooms 1,812 8 rooms 2,840 9+ rooms
Rooms in renter-occupied apartments in Bellingham, Washington
4,069 1 room 2,818 2 rooms 4,560 3 rooms 6,418 4 rooms 2,439 5 rooms 1,417 6 rooms 568 7 rooms 352 8 rooms 490 9+ rooms
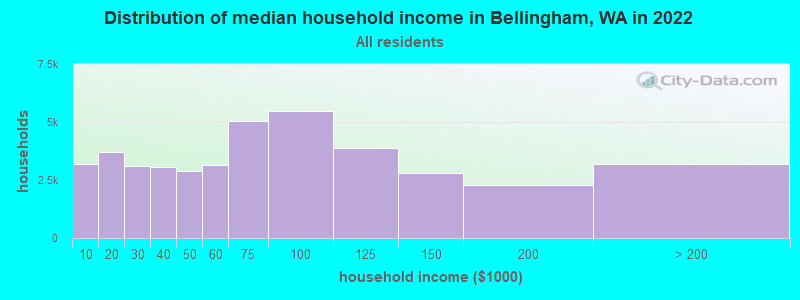
Bellingham, WA household income distribution 3,170 Less than $10,0003,727 $10,000 to $19,9993,101 $20,000 to $29,9993,043 $30,000 to $39,9992,907 $40,000 to $49,9993,134 $50,000 to $59,9995,046 $60,000 to $74,9995,460 $75,000 to $99,9993,862 $100,000 to $124,9992,804 $125,000 to $149,9992,306 $150,000 to $199,9993,186 $200,000 or more
Home value of owner - occupied houses in 2022 in Bellingham, WA 46 Less than $10,0005 $10,000 to $14,99938 $15,000 to $19,9997 $20,000 to $24,99960 $30,000 to $34,9999 $35,000 to $39,99985 $40,000 to $49,999170 $50,000 to $59,99946 $60,000 to $69,99933 $70,000 to $79,99988 $80,000 to $89,99987 $90,000 to $99,999119 $100,000 to $124,999108 $125,000 to $149,99953 $150,000 to $174,99973 $175,000 to $199,999523 $200,000 to $249,999554 $250,000 to $299,9991,456 $300,000 to $399,9992,722 $400,000 to $499,9998,035 $500,000 to $749,9994,507 $750,000 to $999,9991,670 $1,000,000 to $1,499,999440 $1,500,000 to $1,999,999511 $2,000,000 or moreRent paid by renters in 2022 in Bellingham, WA 129 Less than $10072 $100 to $149126 $150 to $199156 $200 to $249215 $250 to $299112 $300 to $34931 $350 to $39976 $400 to $44919 $450 to $499116 $500 to $54968 $550 to $599169 $600 to $649302 $650 to $699462 $700 to $749314 $750 to $799474 $800 to $8991,539 $900 to $9993,686 $1,000 to $1,2496,038 $1,250 to $1,4994,573 $1,500 to $1,9991,980 $2,000 to $2,499296 $2,500 to $2,999163 $3,000 to $3,499759 $3,500 or more280 No cash rent
Percentage of workers working in this county: 92.3%Number of people working at home: 9,075 (17.5% of all workers )
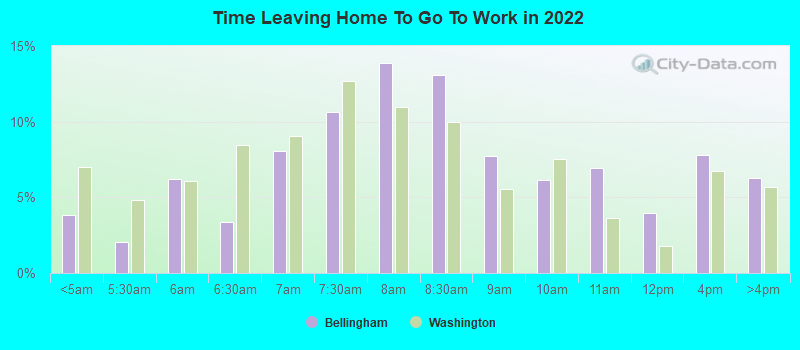
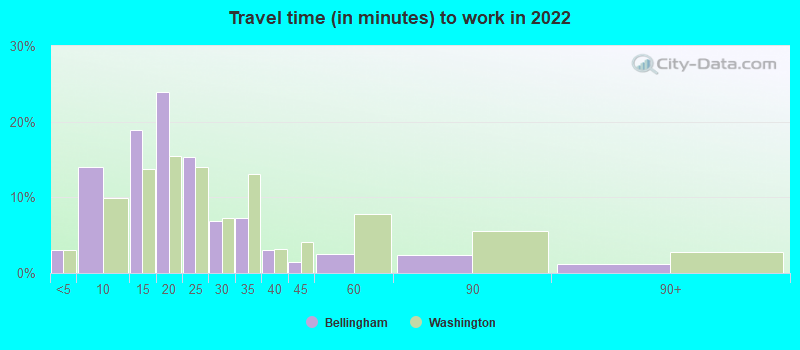
Travel time to work (commute)
Less than 5 minutes: 1,4945 to 9 minutes: 7,66310 to 14 minutes: 9,99215 to 19 minutes: 10,77620 to 24 minutes: 4,37725 to 29 minutes: 2,07430 to 34 minutes: 2,00835 to 39 minutes: 66340 to 44 minutes: 53245 to 59 minutes: 1,31660 to 89 minutes: 1,50090 or more minutes: 483
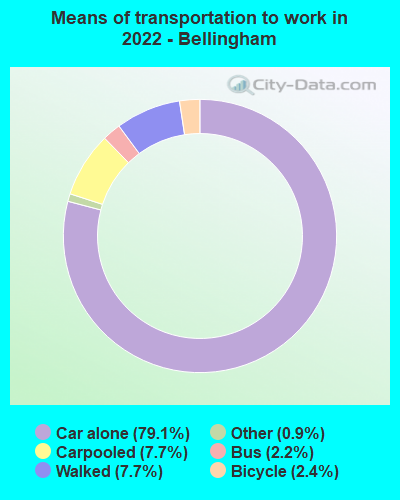
Means of transportation to work:
Drove a car alone: 45,814 (70.3%)Carpooled: 4,481 (6.9%)Bus : 1,250 (1.9%)Taxi: 514 (0.8%)Bicycle: 1,415 (2.2%)Walked: 4,480 (6.9%)Worked at home: 7,212 (11.1%)
Unemployment by race in 2022
Unemployment rate for White non-Hispanic residents 5.2% Males2.4% FemalesUnemployment rate for Black residents 1.5% MalesUnemployment rate for American Indian and Alaska Native residents 23.7% Males8.8% FemalesUnemployment rate for Asian residents 1.4% Males0.5% FemalesUnemployment rate for other race residents 3.8% Males2.7% FemalesUnemployment rate for two or more race residents 4.4% Males4.9% FemalesUnemployment rate for Hispanic or Latino residents 3.8% Males4.0% Females
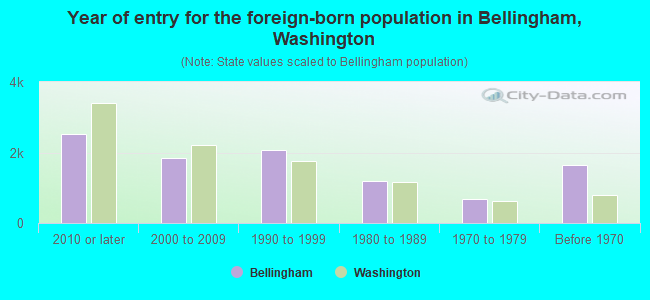
Year of entry for the foreign-born population in Bellingham, Washington
2,528 2010 or later 1,845 2000 to 2009 2,061 1990 to 1999 1,189 1980 to 1989 694 1970 to 1979 1,645 Before 1970
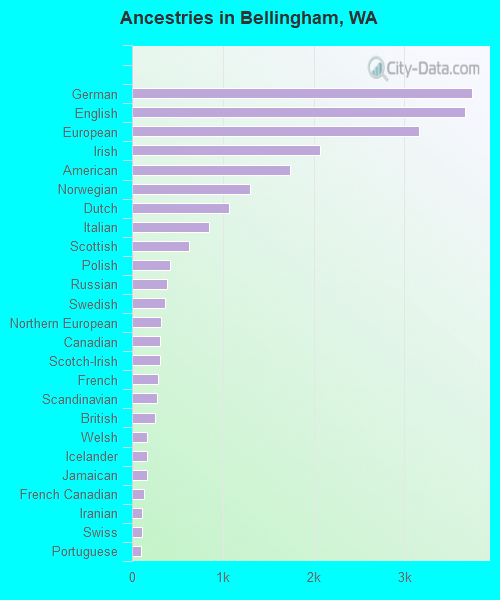
First ancestries reported:
German: 3,744 (9.9%)
English: 3,663 (9.7%)
European: 3,160 (8.4%)
Irish: 2,071 (5.5%)
American: 1,745 (4.6%)
Norwegian: 1,302 (3.5%)
Dutch: 1,068 (2.8%)
Italian: 852 (2.3%)
Scottish: 626 (1.7%)
Polish: 423 (1.1%)
Russian: 387 (1.0%)
Swedish: 360 (1.0%)
Northern European: 318 (0.8%)
Canadian: 312 (0.8%)
Scotch-Irish: 307 (0.8%)
French: 284 (0.8%)
Scandinavian: 280 (0.7%)
British: 257 (0.7%)
Welsh: 162 (0.4%)
Icelander: 161 (0.4%)
Jamaican: 160 (0.4%)
French Canadian: 133 (0.4%)
Iranian: 107 (0.3%)
Swiss: 106 (0.3%)
Portuguese: 101 (0.3%)
Serbian: 100 (0.3%)
Lithuanian: 84 (0.2%)
Celtic: 74 (0.2%)
Ukrainian: 71 (0.2%)
Eastern European: 71 (0.2%)
Finnish: 71 (0.2%)
Yugoslavian: 66 (0.2%)
Danish: 66 (0.2%)
Czech: 63 (0.2%)
Bulgarian: 54 (0.1%)
Austrian: 52 (0.1%)
Romanian: 48 (0.1%)
Egyptian: 45 (0.1%)
Estonian: 41 (0.1%)
Greek: 37 (0.10%)
Ethiopian: 35 (0.09%)
Turkish: 27 (0.07%)
Arab: 23 (0.06%)
Hungarian: 19 (0.05%)
Slovene: 19 (0.05%)
Australian: 18 (0.05%)
Latvian: 16 (0.04%)
Croatian: 14 (0.04%)
Carpatho Rusyn: 11 (0.03%)
Belgian: 10 (0.03%)
Haitian: 10 (0.03%)
African: 9 (0.02%)
Somali: 5 (0.01%)
Most common places of birth for foreign-born residents (%): Canada Bellingham:
14.4% (1,278)Washington:
4.1% (47,238)
Mexico Bellingham:
14.1% (1,250)Washington:
21.1% (241,655)
China, excluding Hong Kong and Taiwan Bellingham:
9.2% (813)Washington:
7.4% (84,470)
India Bellingham:
7.8% (686)Washington:
8.9% (101,353)
Philippines Bellingham:
6.7% (594)Washington:
6.3% (71,661)
Vietnam Bellingham:
4.6% (408)Washington:
5.4% (62,003)
Germany Bellingham:
4.0% (353)Washington:
1.6% (17,761)
Thailand Bellingham:
3.3% (289)Washington:
0.9% (9,937)
Korea Bellingham:
2.8% (247)Washington:
4.3% (48,886)
Japan Bellingham:
2.7% (241)Washington:
1.5% (17,453)
England Bellingham:
2.5% (219)Washington:
0.8% (9,457)
Russia Bellingham:
2.5% (218)Washington:
1.9% (21,540)
Taiwan Bellingham:
1.6% (138)Washington:
1.5% (16,607)
Honduras Bellingham:
1.6% (138)Washington:
0.6% (6,500)
Place of birth for U.S.-born residents:
This state: 43,482Other state: 37,535Northeast: 5,066Midwest: 8,218South: 6,053West: 18,198 78.5% of Bellingham residents lived in the same house 1 years ago.
Out of people who lived in different houses, 30.9% lived in this county.
Out of people who lived in different counties, 71.8% lived in Washington.
Bellingham:
78.5%State average:
85.2%
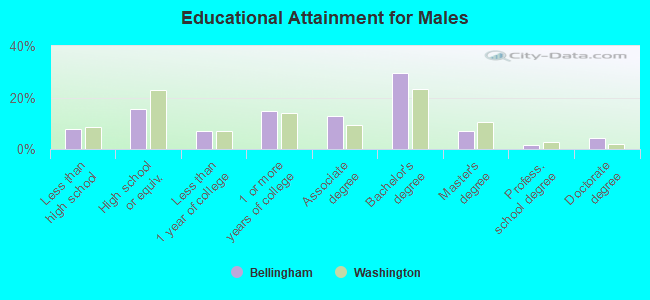
Education attainment for males 25 years and older:
No schooling: 265Nursery to 4th grade: 1485th and 6th grade: 3127th and 8th grade: 1179th grade: 25610th grade: 45311th grade: 46412th grade, no diploma: 305High school graduate (or equivalency): 4,753Less than 1 year of college: 2,145Some college more than 1 year, no degree: 4,476Associate degree: 3,934Bachelor's degree: 8,984Master's degree: 2,089Professional school degree: 446Doctorate degree: 1,279
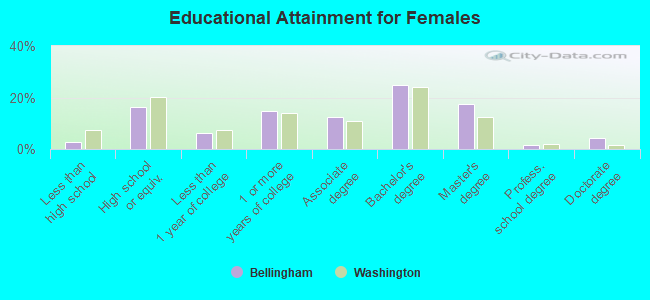
Education attainment for females 25 years and older:
No schooling: 0Nursery to 4th grade: 425th and 6th grade: 3087th and 8th grade: 09th grade: 5310th grade: 5111th grade: 3812th grade, no diploma: 342High school graduate (or equivalency): 5,046Less than 1 year of college: 1,882Some college more than 1 year, no degree: 4,633Associate degree: 3,800Bachelor's degree: 7,686Master's degree: 5,386Professional school degree: 456Doctorate degree: 1,278
Housing units in structures:
One, detached: 17,299One, attached: 1,779Two: 2,2873 or 4: 2,7145 to 9: 3,34310 to 19: 5,58520 to 49: 5,47050 or more: 4,326Mobile homes: 1,115Boats, RVs, vans, etc.: 55Median worth of mobile homes: $119,344
Housing units lacking complete plumbing facilities in 2022: 2.2%Housing units lacking complete kitchen facilities in 2022: 2.7%House/condo owner moved in on average 10 years ago
Renter moved in on average 2 years ago
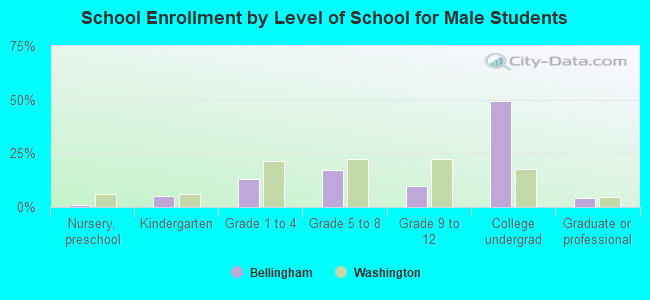
Private vs. public school enrollment:
Students in private schools in grades 1 to 8 (elementary and middle school): 2,443 Here:
33.9%Washington:
12.4%
Students in private schools in grades 9 to 12 (high school): 600 Here:
21.1%Washington:
9.2%
Students in private undergraduate colleges: 872 Here:
6.3%Washington:
16.5%