Bennington, KS (Kansas) Houses and Residents
| Bennington: | $135,223 |
| Kansas: | $206,600 |
Mean price in 2022:
Detached houses: $146,081
Here: $146,081 State: $264,181 Mobile homes: $41,848
Here: $41,848 State: $74,712
Total population: 665 (Urban population: 0, Rural population: 621 (all nonfarm))
Houses: 284 (258 occupied: 205 owner occupied, 56 renter occupied)
| % of renters here: | 21% |
| State: | 32% |
Housing density: 672 houses/condos per square mile
Median price asked for vacant for-sale houses and condos in 2022 in this county: $131,386.
Median contract rent in 2022: $658 (lower quartile is $475, upper quartile is $689)
Median rent asked for vacant for-rent units in 2022: $637
Median gross rent in Bennington, KS in 2022: $842
Housing units in Bennington with a mortgage: 80 (2 second mortgage, 0 home equity loan, 0 both second mortgage and home equity loan)
Houses without a mortgage: 0
Median household income for houses/condos with a mortgage: $81,933
Median household income for apartments without a mortgage: $78,165
Median monthly housing costs: $819
Compare current foreclosures near Bennington, KS:
| Photo | Address | Area | Beds / Baths | Price | Details |
|---|---|---|---|---|---|

|
#1
N Parker St
Bennington, KS 67422
|
1,148 sq. feet
|
1 baths 3 beds |
show details | |

|
#2
W Princeton St
Bennington, KS 67422
|
1,572 sq. feet
|
1 baths 3 beds |
show details | |

|
#3
N 170th Rd
Bennington, KS 67422
|
- sq. feet
|
- baths - beds |
show details | |

|
#4
N Parker St
Bennington, KS 67422
|
- sq. feet
|
- baths - beds |
show details | |

|
#5
E Elm St
Salina, KS 67401
|
1,124 sq. feet
|
1 baths 2 beds |
show details | |

|
#6
Morningside Dr
Salina, KS 67401
|
1,218 sq. feet
|
1 baths 3 beds |
show details | |

|
#7
Johnstown Ave
Salina, KS 67401
|
1,726 sq. feet
|
2 baths 3 beds |
show details | |

|
#8
E Ash St
Salina, KS 67401
|
1,070 sq. feet
|
1 baths 3 beds |
show details | |

|
#9
Louise Ln
Salina, KS 67401
|
1,272 sq. feet
|
3 baths 3 beds |
show details | |

|
#10
S 1st Ave
Minneapolis, KS 67467
|
1,409 sq. feet
|
2 baths 3 beds |
show details |
| Photo | Address | Area | Beds / Baths | Price | Details |
|---|---|---|---|---|---|

|
#11
E Wilson St
Salina, KS 67401
|
1,284 sq. feet
|
1 baths 3 beds |
show details | |

|
#12
S Delaware Ave
Salina, KS 67401
|
1,040 sq. feet
|
2 baths 3 beds |
show details | |

|
#13
Montrose St
Salina, KS 67401
|
1,008 sq. feet
|
2 baths 2 beds |
show details | |

|
#14
N Poplar St
Solomon, KS 67480
|
1,560 sq. feet
|
1 baths 4 beds |
show details | |

|
#15
Montrose St
Salina, KS 67401
|
785 sq. feet
|
2 baths 2 beds |
show details | |

|
#16
E Prescott Ave
Salina, KS 67401
|
1,554 sq. feet
|
1 baths 3 beds |
show details | |

|
#17
W 5th St
Solomon, KS 67480
|
783 sq. feet
|
1 baths 2 beds |
show details | |

|
#18
W Bond St
Salina, KS 67401
|
1,322 sq. feet
|
3 baths 4 beds |
show details | |

|
#19
Hanson Holw
Salina, KS 67401
|
2,331 sq. feet
|
2 baths 3 beds |
show details | |

|
#20
Oak Cir
Salina, KS 67401
|
864 sq. feet
|
1 baths 3 beds |
show details |
| Photo | Address | Area | Beds / Baths | Price | Details |
|---|---|---|---|---|---|

|
#21
Russell Ave
Salina, KS 67401
|
1,043 sq. feet
|
1 baths 3 beds |
show details | |

|
#22
Lorianna Ct
Salina, KS 67401
|
1,766 sq. feet
|
2 baths 3 beds |
show details | |

|
#23
Hemlock Dr
Salina, KS 67401
|
864 sq. feet
|
1 baths 2 beds |
show details | |

|
#24
E Minneapolis Ave
Salina, KS 67401
|
1,364 sq. feet
|
2 baths 3 beds |
show details | |

|
#25
Simmons St
Salina, KS 67401
|
1,341 sq. feet
|
2 baths 3 beds |
show details | |

|
#26
S 10th St
Salina, KS 67401
|
1,355 sq. feet
|
1 baths 3 beds |
show details | |

|
#27
S 4th St
Salina, KS 67401
|
1,156 sq. feet
|
1 baths 3 beds |
show details | |

|
#28
Bachtold Ave
Salina, KS 67401
|
720 sq. feet
|
1 baths 2 beds |
show details | |

|
#29
Bel Air Dr
Salina, KS 67401
|
1,025 sq. feet
|
1 baths 3 beds |
show details | |

|
#30
S 10th St
Salina, KS 67401
|
1,368 sq. feet
|
1 baths 3 beds |
show details |
| Photo | Address | Area | Beds / Baths | Price | Details |
|---|---|---|---|---|---|

|
#31
S Simpson Rd
Salina, KS 67401
|
1,432 sq. feet
|
1 baths 3 beds |
show details | |

|
#32
Drake Pl
Salina, KS 67401
|
1,102 sq. feet
|
1 baths 3 beds |
show details | |

|
#33
N College Ave
Salina, KS 67401
|
2,137 sq. feet
|
2 baths 4 beds |
show details | |

|
#34
W Ash St
Salina, KS 67401
|
1,988 sq. feet
|
2 baths 3 beds |
show details | |

|
#35
1/2 N 3rd Ave
Minneapolis, KS 67467
|
1,640 sq. feet
|
4 baths 5 beds |
show details | |

|
#36
Melrose Ln
Salina, KS 67401
|
2,068 sq. feet
|
2 baths 3 beds |
show details | |

|
#37
S West Pl
Salina, KS 67401
|
1,664 sq. feet
|
2 baths 4 beds |
show details | |

|
#38
N 2nd St
Salina, KS 67401
|
832 sq. feet
|
1 baths 1 beds |
show details | |

|
#39
S 12th St
Salina, KS 67401
|
2,876 sq. feet
|
4 baths 4 beds |
show details | |

|
#40
S 11th St
Salina, KS 67401
|
1,740 sq. feet
|
2 baths 4 beds |
show details |
| Photo | Address | Area | Beds / Baths | Price | Details |
|---|---|---|---|---|---|

|
#41
S Delaware Ave
Salina, KS 67401
|
704 sq. feet
|
1 baths 2 beds |
show details | |

|
#42
N College Ave
Salina, KS 67401
|
1,072 sq. feet
|
1 baths 2 beds |
show details | |

|
#43
N 12th St
Salina, KS 67401
|
754 sq. feet
|
1 baths 2 beds |
show details | |

|
#44
N 2nd St
Salina, KS 67401
|
1,252 sq. feet
|
1 baths 2 beds |
show details | |

|
#45
S College Ave
Salina, KS 67401
|
4,804 sq. feet
|
2 baths 4 beds |
show details | |

|
#46
Willis Ave
Salina, KS 67401
|
- sq. feet
|
- baths - beds |
show details | |

|
#47
E North St
Salina, KS 67401
|
- sq. feet
|
- baths - beds |
show details | |

|
#48
N Broadway Blvd # 119
Salina, KS 67401
|
- sq. feet
|
10 baths - beds |
show details | |

|
#49
N Mill St
Minneapolis, KS 67467
|
- sq. feet
|
- baths - beds |
show details | |

|
Check over 1 million property listings on Foreclosure.com!
|
browse all offers | |||

Latest news about housing in Bennington, KS collected exclusively by city-data.com from local newspapers, TV, and radio stations


Median year apartment built: 1993
Household type by relationship:
Households: 574- Male householders: 133 (40 living alone), Female householders: 123 (26 living alone)
134 spouses (134 opposite-sex spouses), 8 unmarried partners, (8 opposite-sex unmarried partners), 164 children (141 natural, 15 adopted, 8 stepchildren), 8 grandchildren, 0 brothers or sisters, 0 parents, 0 foster children, 0 other relatives, 4 non-relatives
Size of family households: 91 2-persons, 29 3-persons, 45 4-persons, 4 7-or-more-persons.
Size of nonfamily households: 68 1-person, 21 2-persons.
82 married couples with children.
31 single-parent households (4 men, 27 women).
97.7% of residents of Bennington speak English at home.
3.4% of residents speak Spanish at home (100% speak English very well).
Foreign born population: 6 (1.0%)
(16.7% of them are naturalized citizens)
| Here: | 6.6 |
| State: | 6.9 |
| Here: | 5.7 |
| State: | 4.4 |

- Bedrooms in owner-occupied houses and condos in Bennington, Kansas
- 0no bedroom
- 31 bedroom
- 572 bedrooms
- 903 bedrooms
- 344 bedrooms
- 215+ bedrooms

- Bedrooms in renter-occupied apartments in Bennington, Kansas
- 4no bedroom
- 01 bedroom
- 352 bedrooms
- 173 bedrooms
- 04 bedrooms
- 05+ bedrooms

- Cars and other vehicles available in Bennington in owner-occupied houses/condos
- 0no vehicle
- 481 vehicle
- 942 vehicles
- 473 vehicles
- 134 vehicles
- 35+ vehicles

- Cars and other vehicles available in Bennington in renter-occupied apartments
- 0no vehicle
- 181 vehicle
- 382 vehicles
- 03 vehicles
- 04 vehicles
- 05+ vehicles

- Rooms in owner-occupied houses in Bennington, Kansas
- 01 room
- 02 rooms
- 03 rooms
- 54 rooms
- 535 rooms
- 436 rooms
- 237 rooms
- 308 rooms
- 529+ rooms

- Rooms in renter-occupied apartments in Bennington, Kansas
- 01 room
- 02 rooms
- 93 rooms
- 64 rooms
- 65 rooms
- 316 rooms
- 47 rooms
- 08 rooms
- 09+ rooms


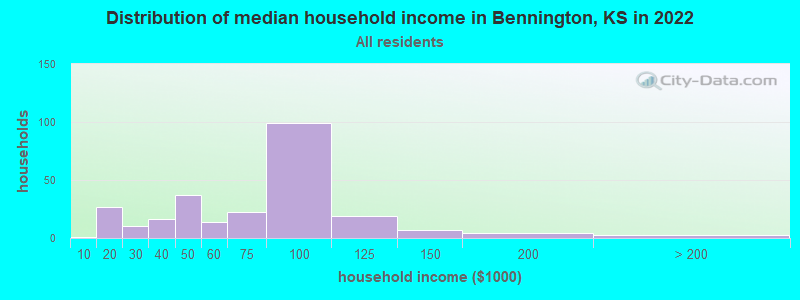
Bennington, KS household income distribution

- 1Less than $10,000
- 27$10,000 to $19,999
- 10$20,000 to $29,999
- 16$30,000 to $39,999
- 37$40,000 to $49,999
- 14$50,000 to $59,999
- 22$60,000 to $74,999
- 99$75,000 to $99,999
- 19$100,000 to $124,999
- 7$125,000 to $149,999
- 4$150,000 to $199,999
- 3$200,000 or more
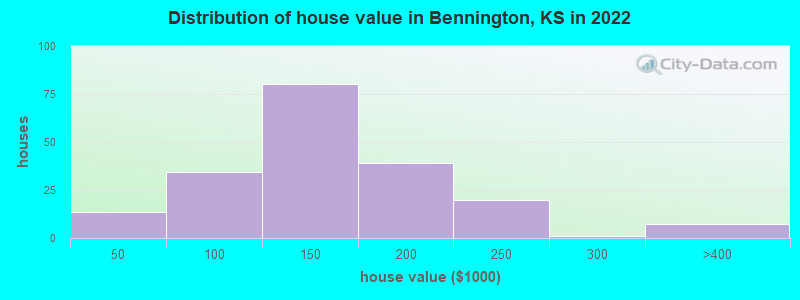
Home value of owner - occupied houses in 2022 in Bennington, KS
-
- 4Less than $10,000
- 4$25,000 to $29,999
- 4$40,000 to $49,999
- 9$50,000 to $59,999
- 1$60,000 to $69,999
- 6$70,000 to $79,999
- 3$80,000 to $89,999
- 8$90,000 to $99,999
- 54$100,000 to $124,999
- 26$125,000 to $149,999
- 28$150,000 to $174,999
- 10$175,000 to $199,999
- 19$200,000 to $249,999
- 1$250,000 to $299,999
- 7$300,000 to $399,999
Rent paid by renters in 2022 in Bennington, KS
-
- 3$150 to $199
- 4$400 to $449
- 12$450 to $499
- 2$500 to $549
- 0$550 to $599
- 2$600 to $649
- 26$650 to $699
- 8$1,000 to $1,249


Percentage of workers working in this county: 40.8%
Number of people working at home: 2 (0.7% of all workers)
Travel time to work (commute)
- Less than 5 minutes: 8
- 5 to 9 minutes: 25
- 10 to 14 minutes: 4
- 15 to 19 minutes: 71
- 20 to 24 minutes: 58
- 25 to 29 minutes: 28
- 30 to 34 minutes: 34
- 35 to 39 minutes: 0
- 40 to 44 minutes: 7
- 45 to 59 minutes: 21
- 60 to 89 minutes: 0
- 90 or more minutes: 15
Means of transportation to work:
- Drove a car alone: 262 (85.6%)
- Carpooled: 29 (9.5%)
- Walked: 1 (0.3%)
- Worked at home: 14 (4.6%)

- Unemployment by race in 2022
- Unemployment rate for White non-Hispanic residents
- 9.2%Males
- 3.9%Females

- Year of entry for the foreign-born population in Bennington, Kansas
- 42010 or later
- 02000 to 2009
- 01990 to 1999
- 01980 to 1989
- 01970 to 1979
- 2Before 1970

First ancestries reported:
- German: 84 (40.5%)
- American: 33 (15.9%)
- Irish: 26 (12.5%)
- Scottish: 12 (5.8%)
- French: 10 (4.8%)
- English: 6 (2.9%)
- European: 6 (2.9%)
- Scotch-Irish: 6 (2.9%)
- Dutch: 5 (2.4%)
- Italian: 5 (2.4%)
- Polish: 5 (2.4%)
Most common places of birth for foreign-born residents (%):
| Bennington: | 60.0% (3) |
| Kansas: | 39.2% (81,282) |
Place of birth for U.S.-born residents:
- This state: 461
- Other state: 104
- Northeast: 8
- Midwest: 22
- South: 17
- West: 58
94.5% of Bennington residents lived in the same house 1 years ago.
Out of people who lived in different houses, 31.9% lived in this county.
Out of people who lived in different counties, 52.9% lived in Kansas.
| Bennington: | 94.5% |
| State average: | 85.3% |
Education attainment for males 25 years and older:
- No schooling: 0
- Nursery to 4th grade: 0
- 5th and 6th grade: 0
- 7th and 8th grade: 0
- 9th grade: 5
- 10th grade: 2
- 11th grade: 11
- 12th grade, no diploma: 0
- High school graduate (or equivalency): 63
- Less than 1 year of college: 17
- Some college more than 1 year, no degree: 37
- Associate degree: 30
- Bachelor's degree: 31
- Master's degree: 3
- Professional school degree: 0
- Doctorate degree: 2

Education attainment for females 25 years and older:
- No schooling: 2
- Nursery to 4th grade: 0
- 5th and 6th grade: 0
- 7th and 8th grade: 0
- 9th grade: 2
- 10th grade: 0
- 11th grade: 0
- 12th grade, no diploma: 1
- High school graduate (or equivalency): 50
- Less than 1 year of college: 23
- Some college more than 1 year, no degree: 30
- Associate degree: 22
- Bachelor's degree: 26
- Master's degree: 26
- Professional school degree: 0
- Doctorate degree: 0


Housing units in structures:
- One, detached: 246
- Two: 19
- 3 or 4: 8
- Mobile homes: 10
Median worth of mobile homes: $62,327
Housing units lacking complete kitchen facilities in 2022: 4.3%
House/condo owner moved in on average 18 years ago
Renter moved in on average 4 years ago

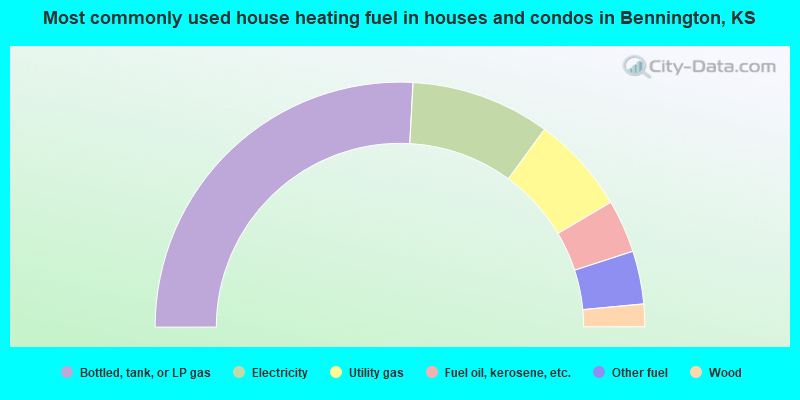
- 51.7%Bottled, tank, or LP gas
- 18.4%Electricity
- 12.9%Utility gas
- 7.0%Fuel oil, kerosene, etc.
- 7.0%Other fuel
- 3.0%Wood
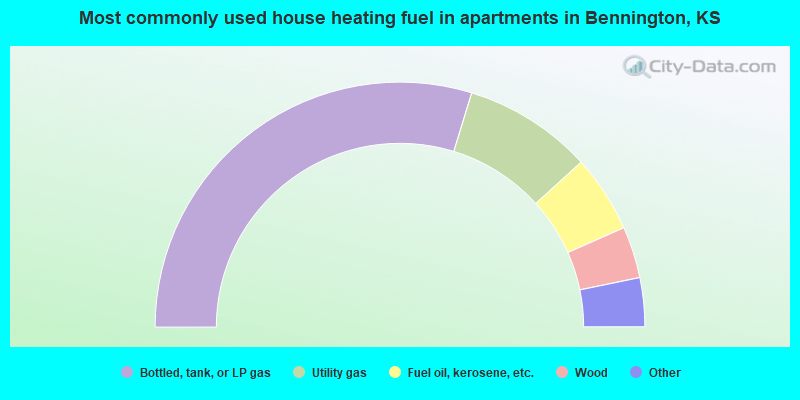
- 63.6%Bottled, tank, or LP gas
- 18.2%Utility gas
- 10.9%Fuel oil, kerosene, etc.
- 7.3%Wood
Private vs. public school enrollment:
| Here: | 10.5% |
| Kansas: | 14.1% |
| Here: | 3.7% |
| Kansas: | 10.8% |
| Here: | 14.3% |
| Kansas: | 15.4% |


