Housing density: 130 houses/condos per square mile
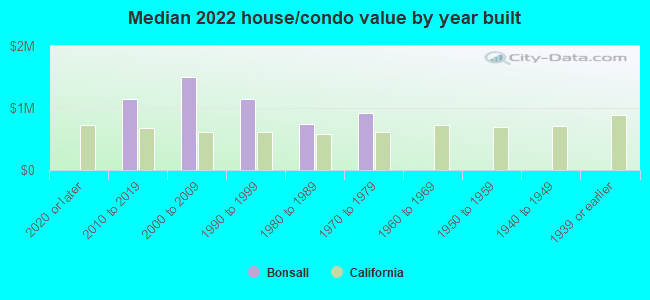
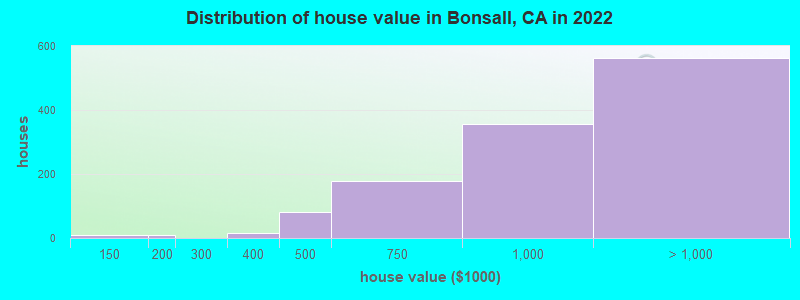
Median price asked for vacant for-sale houses and condos in 2022 in this county: $1,340,665.
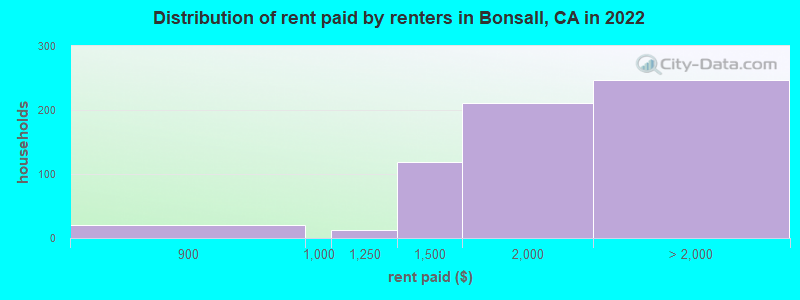
Median contract rent in 2022: $1,872 (lower quartile is $1,508, upper quartile is over $2,000)
Median rent asked for vacant for-rent units in 2022: $2,304
Median gross rent in Bonsall, CA in 2022: over $2,000
Housing units in Bonsall with a mortgage: 780 (68 second mortgage, 0 home equity loan, 62 both second mortgage and home equity loan) Houses without a mortgage: 0
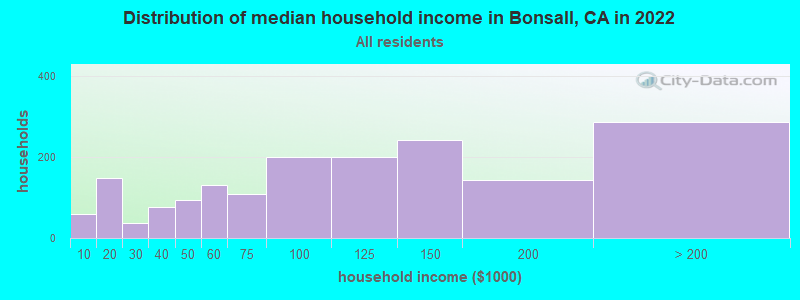
Median household income for houses/condos with a mortgage: $128,354
Median household income for apartments without a mortgage: $95,856
Size of family households: 626 2-persons, 309 3-persons, 191 4-persons, 19 5-persons, 27 6-persons.
Size of nonfamily households: 411 1-person, 114 2-persons, 46 3-persons.
538 married couples with children.
207 single-parent households (36 men, 171 women).
75.7% of residents of Bonsall speak English at home.
17.2% of residents speak Spanish at home (83% speak English very well, 4% speak English well, 14% speak English not well).
6.0% of residents speak other Indo-European language at home (90% speak English very well, 3% speak English well, 7% speak English not well).
0.6% of residents speak Asian or Pacific Island language at home (71% speak English very well, 29% speak English well).
1.4% of residents speak other language at home (85% speak English very well, 15% speak English well).
Foreign born population: 608 (14.8%)
(86.8% of them are naturalized citizens)
Percentage of workers working in this county: 92.1% Number of people working at home: 369 (20.1% of all workers)
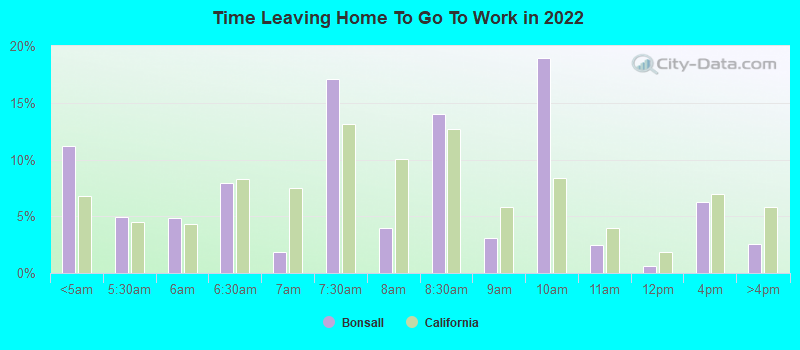
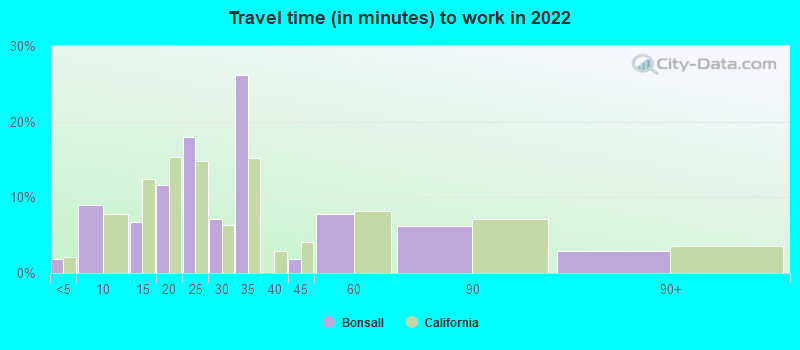
Travel time to work (commute)
Less than 5 minutes: 97
5 to 9 minutes: 72
10 to 14 minutes: 68
15 to 19 minutes: 150
20 to 24 minutes: 199
25 to 29 minutes: 49
30 to 34 minutes: 365
35 to 39 minutes: 93
40 to 44 minutes: 25
45 to 59 minutes: 187
60 to 89 minutes: 129
90 or more minutes: 28
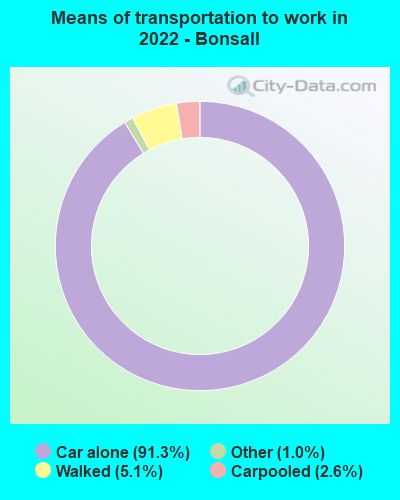
Means of transportation to work:
Drove a car alone: 609 (61.0%)
Carpooled: 18 (1.8%)
Taxi: 7 (0.7%)
Walked: 37 (3.7%)
Worked at home: 369 (37.0%)
Unemployment by race in 2022
Unemployment rate for White non-Hispanic residents
9.5%Males
5.6%Females
Unemployment rate for other race residents
6.2%Females
Unemployment rate for Hispanic or Latino residents
9.0%Males
1.6%Females
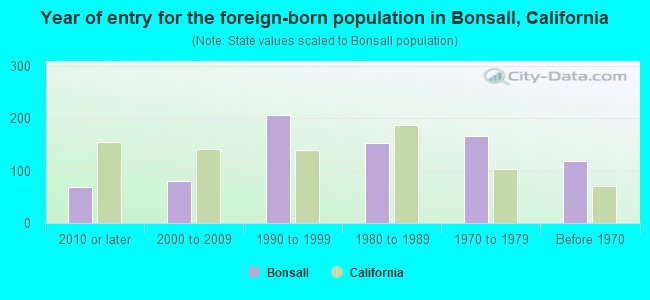
Year of entry for the foreign-born population in Bonsall, California
682010 or later
812000 to 2009
2061990 to 1999
1531980 to 1989
1661970 to 1979
118Before 1970
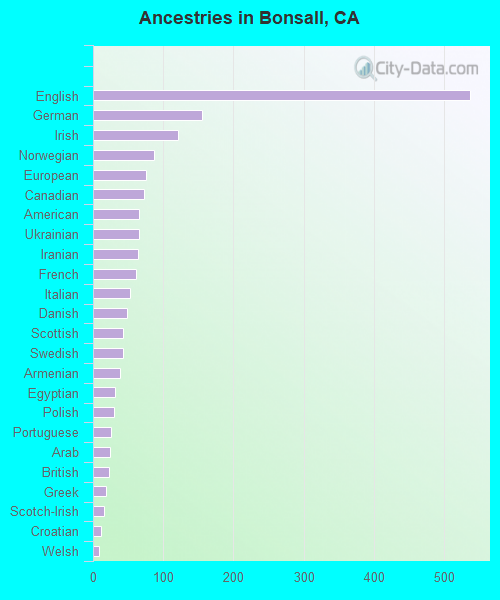
First ancestries reported:
English: 537 (21.4%)
German: 155 (6.2%)
Irish: 121 (4.8%)
Norwegian: 87 (3.5%)
European: 76 (3.0%)
Canadian: 73 (2.9%)
American: 65 (2.6%)
Ukrainian: 65 (2.6%)
Iranian: 64 (2.6%)
French: 61 (2.4%)
Italian: 52 (2.1%)
Danish: 48 (1.9%)
Scottish: 43 (1.7%)
Swedish: 43 (1.7%)
Armenian: 38 (1.5%)
Egyptian: 31 (1.2%)
Polish: 30 (1.2%)
Portuguese: 26 (1.0%)
Arab: 24 (1.0%)
British: 23 (0.9%)
Greek: 19 (0.8%)
Scotch-Irish: 15 (0.6%)
Croatian: 12 (0.5%)
Welsh: 8 (0.3%)
Slavic: 3 (0.1%)
Most common places of birth for foreign-born residents (%):
Mexico
Bonsall:
28.6% (174)
California:
37.2% (3,881,193)
France
Bonsall:
10.4% (63)
California:
0.4% (40,224)
Canada
Bonsall:
9.2% (56)
California:
1.2% (127,477)
Other Eastern Europe
Bonsall:
7.4% (45)
California:
0.2% (17,699)
Iran
Bonsall:
7.1% (43)
California:
2.0% (206,004)
England
Bonsall:
5.8% (35)
California:
0.6% (57,953)
Germany
Bonsall:
5.1% (31)
California:
0.7% (73,304)
China, excluding Hong Kong and Taiwan
Bonsall:
4.3% (26)
California:
6.6% (684,672)
Belgium
Bonsall:
3.6% (22)
California:
0.1% (6,176)
Poland
Bonsall:
3.5% (21)
California:
0.2% (20,997)
Lebanon
Bonsall:
2.6% (16)
California:
0.3% (31,757)
Philippines
Bonsall:
2.6% (16)
California:
7.8% (818,297)
Jordan
Bonsall:
2.5% (15)
California:
0.2% (16,384)
United Kingdom, excluding England and Scotland
Bonsall:
2.5% (15)
California:
0.6% (60,582)
Pakistan
Bonsall:
2.3% (14)
California:
0.5% (49,399)
Egypt
Bonsall:
2.1% (13)
California:
0.4% (42,718)
Other Northern Africa
Bonsall:
2.0% (12)
California:
0.0% (3,349)
Vietnam
Bonsall:
1.8% (11)
California:
4.9% (512,335)
Syria
Bonsall:
1.8% (11)
California:
0.3% (30,949)
Denmark
Bonsall:
1.6% (10)
California:
0.1% (6,555)
Place of birth for U.S.-born residents:
This state: 2,242
Other state: 1,218
Northeast: 183
Midwest: 535
South: 332
West: 157
84.7% of Bonsall residents lived in the same house 1 years ago. Out of people who lived in different houses, 47.9% lived in this county. Out of people who lived in different counties, 30.3% lived in California.
Bonsall:
84.7%
State average:
88.9%
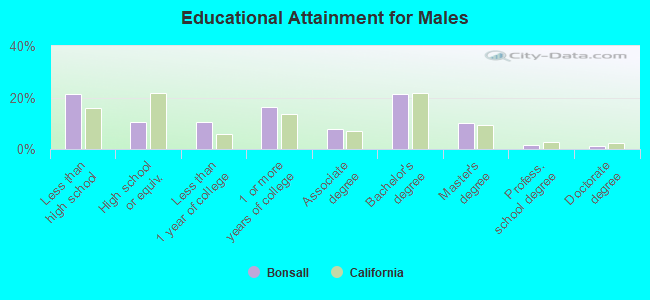
Education attainment for males 25 years and older:
No schooling: 0
Nursery to 4th grade: 0
5th and 6th grade: 0
7th and 8th grade: 0
9th grade: 0
10th grade: 50
11th grade: 151
12th grade, no diploma: 110
High school graduate (or equivalency): 152
Less than 1 year of college: 155
Some college more than 1 year, no degree: 242
Associate degree: 114
Bachelor's degree: 311
Master's degree: 146
Professional school degree: 23
Doctorate degree: 15
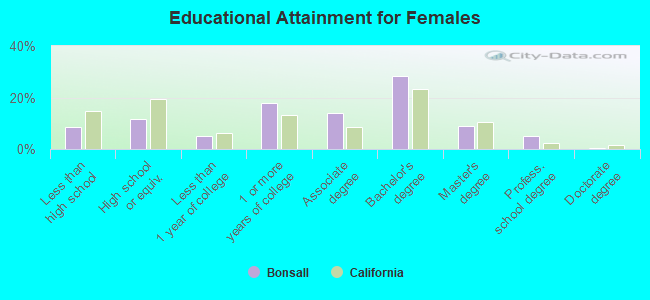
Education attainment for females 25 years and older:
No schooling: 9
Nursery to 4th grade: 7
5th and 6th grade: 0
7th and 8th grade: 28
9th grade: 35
10th grade: 6
11th grade: 49
12th grade, no diploma: 0
High school graduate (or equivalency): 180
Less than 1 year of college: 75
Some college more than 1 year, no degree: 272
Associate degree: 215
Bachelor's degree: 439
Master's degree: 137
Professional school degree: 78
Doctorate degree: 9
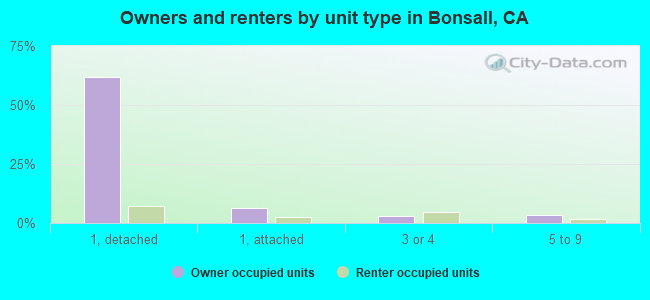
Housing units in structures:
One, detached: 1,047
One, attached: 281
Two: 11
3 or 4: 40
5 to 9: 55
10 to 19: 39
20 to 49: 181
Mobile homes: 90
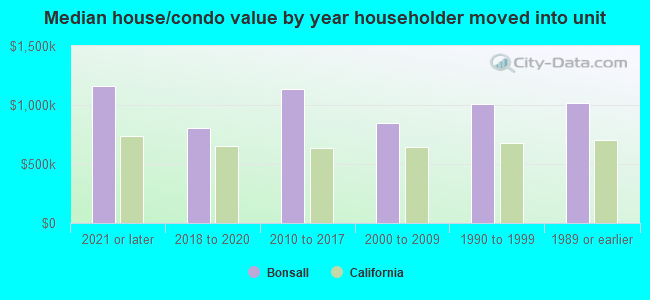
House/condo owner moved in on average 11 years ago