Cape Girardeau, MO (Missouri) Houses and Residents
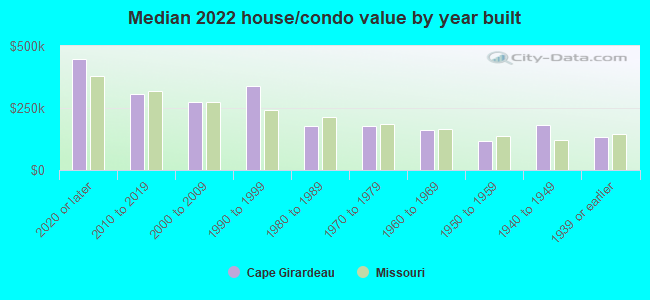
Estimated median house or condo value in 2022: $187,645 (it was $88,800 in 2000 )
Cape Girardeau:
$187,645Missouri:
$221,200
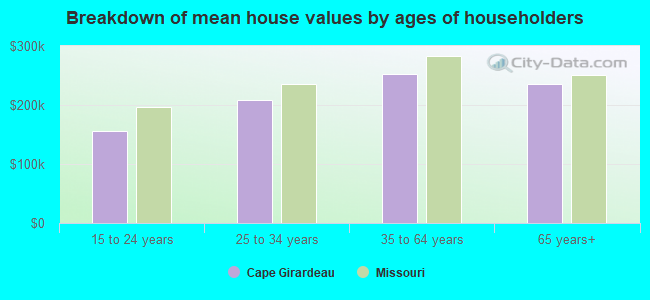
Lower value quartile - upper value quartile: $137,611 - $305,475Mean price in 2022: Detached houses: $240,335 Here:
$240,335State:
$278,068
Townhouses or other attached units: $462,555 Here:
$462,555State:
$260,773
In 2-unit structures: $249,067 Here:
$249,067State:
$172,667
In 5-or-more-unit structures: $87,233 Here:
$87,233State:
$263,082
Mobile homes: $22,258 Here:
$22,258State:
$95,912
Total population: 39,167 (Urban population: 34,658 (all inside urban clusters), Rural population: 661 (all nonfarm) )
Houses: 18,615 (16,152 occupied: 8,930 owner occupied, 7,651 renter occupied )
% of renters here:
46%State:
32%
Housing density: 767 houses/condos per square mile
Median price asked for vacant for-sale houses and condos in 2022: $113,126.
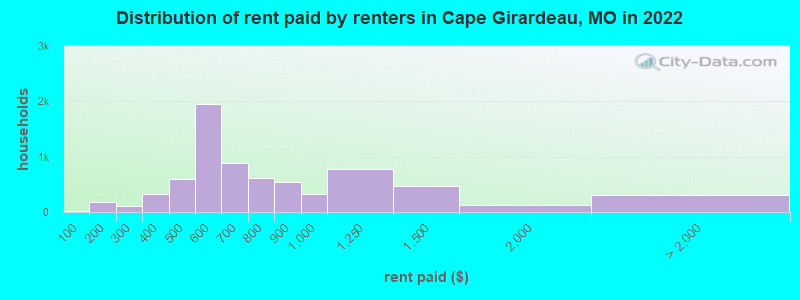
Median contract rent in 2022: $620 (lower quartile is $505, upper quartile is $1,008)
Median rent asked for vacant for-rent units in 2022: $732
Median gross rent in Cape Girardeau, MO in 2022: $806
Housing units in Cape Girardeau with a mortgage: 4,970 (428 second mortgage, 0 home equity loan, 355 both second mortgage and home equity loan )Houses without a mortgage: 53
Median household income for houses/condos with a mortgage: $97,283
Median household income for apartments without a mortgage: $57,486
Median monthly housing costs: $829
Data:
Median house or condo value ($)
Median house or condo value ($ change since 2000)
Median house or condo value ($) - White
Median house or condo value ($) - Black or African American
Median house or condo value ($) - Asian
Median house or condo value ($) - Hispanic or Latino
Median house or condo value ($) - American Indian and Alaska Native
Median house or condo value ($) - Multirace
Median house or condo value ($) - Other Race
Median price asked for mobile homes ($)
Household density (households per square mile)
Mean house or condo value by units in structure - 1, detached ($)
Mean house or condo value by units in structure - 1, attached ($)
Mean house or condo value by units in structure - 2 ($)
Mean house or condo value by units in structure by units in structure - 3 or 4 ($)
Mean house or condo value by units in structure - 5 or more ($)
Mean house or condo value by units in structure - Boat, RV, van, etc. ($)
Mean house or condo value by units in structure - Mobile home ($)
Median contract rent ($)
Median contract rent - Lower quartile ($)
Median contract rent - Upper quartile ($)
Median gross rent ($)
Urban houses (%)
Rural houses (%)
Houses occupied (%)
Houses occupied (% change since 2000)
Houses owner occupied (%)
Houses owner occupied (% change since 2000)
Houses renter occupied (%)
Houses renter occupied (% change since 2000)
Vacant housing units - For rent (%)
Vacant housing units - For rent (% change since 2000)
Vacant housing units - For sale only (%)
Vacant housing units - For sale only (% change since 2000)
Vacant housing units - Rented or sold, not occupied (%)
Vacant housing units - Rented or sold, not occupied (% change since 2000)
Vacant housing units - For seasonal, recreational, or occasional use (%)
Vacant housing units - For seasonal, recreational, or occasional use (% change since 2000)
Vacant housing units - For migrant workers (%)
Vacant housing units - For migrant workers (% change since 2000)
Vacant housing units - Other vacant (%)
Vacant housing units - Other vacant (% change since 2000)
Median monthly housing costs ($)
Median household income for houses/condos with a mortgage ($)
Median household income for houses/condos without a mortgage ($)
Median household income ($)
Median household income ($) - White
Median household income ($) - Black or African American
Median household income ($) - Asian
Median household income ($) - Hispanic or Latino
Median household income ($) - American Indian and Alaska Native
Median household income ($) - Multirace
Median household income ($) - Other Race
Mortgage status - with mortgage (%)
Mortgage status - with second mortgage (%)
Mortgage status - with home equity loan (%)
Mortgage status - with both second mortgage and home equity loan (%)
Mortgage status - without a mortgage (%)
Median year house/condo built
Median year apartment built
Household type by relationship - Male householder living alone (%)
Household type by relationship - Male householder not living alone (%)
Household type by relationship - Female householder living alone (%)
Household type by relationship - Female householder not living alone (%)
Household type by relationship - Opposite-Sex spouse (%)
Household type by relationship - Same-Sex spouse (%)
Household type by relationship - Opposite-Sex unmarried partner (%)
Household type by relationship - Same-Sex unmarried partner (%)
Household type by relationship - In group quarters (%)
Size of family households - 2-person household (%)
Size of family households - 3-person household (%)
Size of family households - 4-person household (%)
Size of family households - 5-person household (%)
Size of family households - 6-person household (%)
Size of family households - 7-or-more-person household (%)
Size of nonfamily households - 1-person household (%)
Size of nonfamily households - 2-person household (%)
Size of nonfamily households - 3-person household (%)
Size of nonfamily households - 4-person household (%)
Size of nonfamily households - 5-person household (%)
Size of nonfamily households - 6-person household (%)
Size of nonfamily households - 7-or-moreperson household (%)
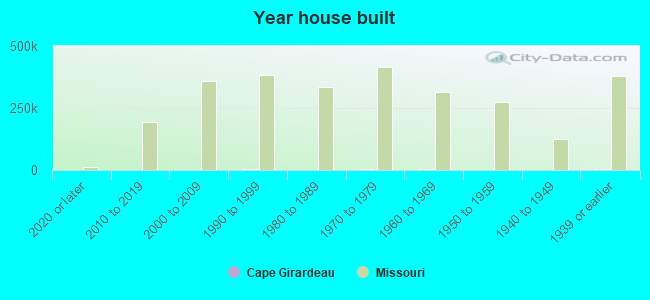
Year house built - Built 2010 or later (%)
Year house built - Built 2000 to 2009 (%)
Year house built - Built 1990 to 1999 (%)
Year house built - Built 1980 to 1989 (%)
Year house built - Built 1970 to 1979 (%)
Year house built - Built 1960 to 1969 (%)
Year house built - Built 1950 to 1959 (%)
Year house built - Built 1940 to 1949 (%)
Year house built - Built 1939 or earlier (%)
Median number of rooms in houses and condos
Median number of rooms in apartments
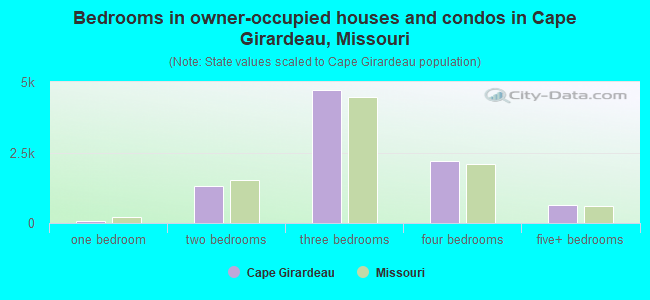
Median number of bedrooms in owner occupied houses
Mean number of bedrooms in owner occupied houses
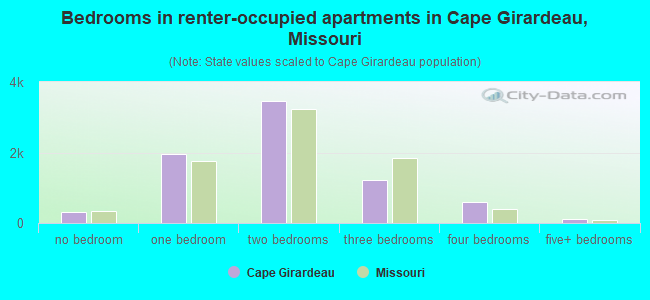
Median number of bedrooms in renter occupied houses
Mean number of bedrooms in renter occupied houses
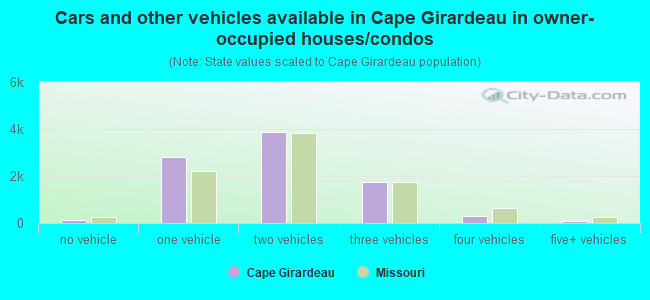
Median number of vehichles in owner occupied houses
Mean number of vehichles in owner occupied houses
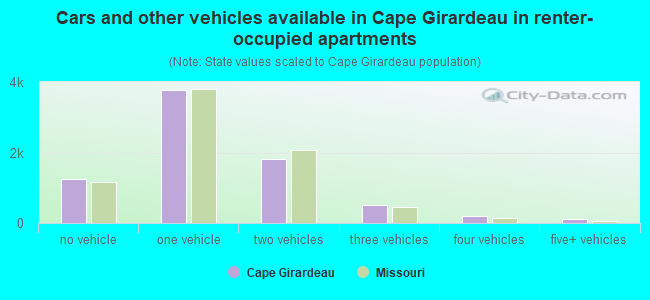
Median number of vehichles in renter occupied houses
Mean number of vehichles in renter occupied houses
Rooms in owner-occupied houses - 1 room (%)
Rooms in owner-occupied houses - 2 rooms (%)
Rooms in owner-occupied houses - 3 rooms (%)
Rooms in owner-occupied houses - 4 rooms (%)
Rooms in owner-occupied houses - 5 rooms (%)
Rooms in owner-occupied houses - 6 rooms (%)
Rooms in owner-occupied houses - 7 rooms (%)
Rooms in owner-occupied houses - 8 rooms (%)
Rooms in owner-occupied houses - 9+ rooms (%)
Rooms in renter-occupied houses - 1 room (%)
Rooms in renter-occupied houses - 2 rooms (%)
Rooms in renter-occupied houses - 3 rooms (%)
Rooms in renter-occupied houses - 4 rooms (%)
Rooms in renter-occupied houses - 5 rooms (%)
Rooms in renter-occupied houses - 6 rooms (%)
Rooms in renter-occupied houses - 7 rooms (%)
Rooms in renter-occupied houses - 8 rooms (%)
Rooms in renter-occupied houses - 9+ rooms (%)
Bedrooms in owner-occupied houses - no bedrooms (%)
Bedrooms in owner-occupied houses - 1 bedroom (%)
Bedrooms in owner-occupied houses - 2 bedrooms (%)
Bedrooms in owner-occupied houses - 3 bedrooms (%)
Bedrooms in owner-occupied houses - 4 bedrooms (%)
Bedrooms in owner-occupied houses - 5+ bedrooms (%)
Bedrooms in renter-occupied houses - no bedrooms (%)
Bedrooms in renter-occupied houses - 1 bedroom (%)
Bedrooms in renter-occupied houses - 2 bedrooms (%)
Bedrooms in renter-occupied houses - 3 bedrooms (%)
Bedrooms in renter-occupied houses - 4 bedrooms (%)
Bedrooms in renter-occupied houses - 5+ bedrooms (%)
Vehicles available in owner-occupied houses - no vehicle available (%)
Vehicles available in owner-occupied houses - 1 vehicle available(%)
Vehicles available in owner-occupied houses - 2 Vehicles available (%)
Vehicles available in owner-occupied houses - 3 Vehicles available (%)
Vehicles available in owner-occupied houses - 4 Vehicles available (%)
Vehicles available in owner-occupied houses - 5+ Vehicles available (%)
Vehicles available in renter-occupied houses - no vehicle available (%)
Vehicles available in renter-occupied houses - 1 vehicle available (%)
Vehicles available in renter-occupied houses - 2 Vehicles available (%)
Vehicles available in renter-occupied houses - 3 Vehicles available (%)
Vehicles available in renter-occupied houses - 4 Vehicles available (%)
Vehicles available in renter-occupied houses - 5+ Vehicles available (%)
Housing units in structures - 1, detached (%)
Housing units in structures - 1, attached (%)
Housing units in structures - 2 (%)
Housing units in structures - 3 or 4 (%)
Housing units in structures - 5 to 9 (%)
Housing units in structures - 10 to 19 (%)
Housing units in structures - 20 to 49 (%)
Housing units in structures - 50 or more (%)
Housing units in structures - Mobile home (%)
Housing units in structures - Boat, RV, van, etc. (%)
Housing units in structures - Owners - 1, detached (%)
Housing units in structures - Owners - 1, attached (%)
Housing units in structures - Owners - 2 (%)
Housing units in structures - Owners - 3 or 4 (%)
Housing units in structures - Owners - 5 to 9 (%)
Housing units in structures - Owners - 10 to 19 (%)
Housing units in structures - Owners - 20 to 49 (%)
Housing units in structures - Owners - 50 or more (%)
Housing units in structures - Owners - Mobile home (%)
Housing units in structures - Owners - Boat, RV, van, etc. (%)
Housing units in structures - Renters - 1, detached (%)
Housing units in structures - Renters - 1, attached (%)
Housing units in structures - Renters - 2 (%)
Housing units in structures - Renters - 3 or 4 (%)
Housing units in structures - Renters - 5 to 9 (%)
Housing units in structures - Renters - 10 to 19 (%)
Housing units in structures - Renters - 20 to 49 (%)
Housing units in structures - Renters - 50 or more (%)
Housing units in structures - Renters - Mobile home (%)
Housing units in structures - Renters - Boat, RV, van, etc. (%)
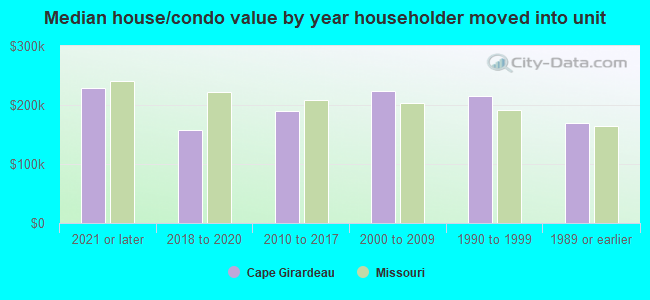
House/condo owner moved in on average (years ago)
Renter moved in on average (years ago)
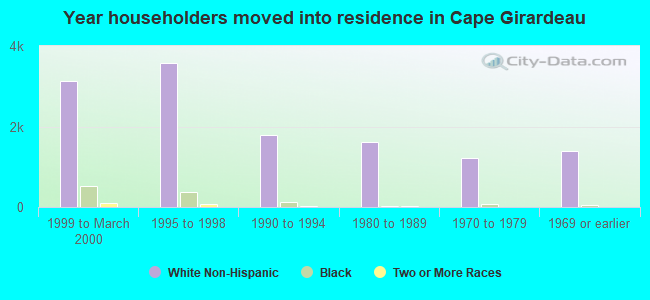
Year householder moved into unit - Moved in 1999 to March 2000 (%)
Year householder moved into unit - Moved in 1999 to March 2000 (%) - White
Year householder moved into unit - Moved in 1999 to March 2000 (%) - Black or African American
Year householder moved into unit - Moved in 1999 to March 2000 (%) - Asian
Year householder moved into unit - Moved in 1999 to March 2000 (%) - Hispanic or Latino
Year householder moved into unit - Moved in 1999 to March 2000 (%) - American Indian and Alaska Native
Year householder moved into unit - Moved in 1999 to March 2000 (%) - Multirace
Year householder moved into unit - Moved in 1999 to March 2000 (%) - Other Race
Year householder moved into unit - Moved in 1995 to 1998 (%)
Year householder moved into unit - Moved in 1995 to 1998 (%) - White
Year householder moved into unit - Moved in 1995 to 1998 (%) - Black or African American
Year householder moved into unit - Moved in 1995 to 1998 (%) - Asian
Year householder moved into unit - Moved in 1995 to 1998 (%) - Hispanic or Latino
Year householder moved into unit - Moved in 1995 to 1998 (%) - American Indian and Alaska Native
Year householder moved into unit - Moved in 1995 to 1998 (%) - Multirace
Year householder moved into unit - Moved in 1995 to 1998 (%) - Other Race
Year householder moved into unit - Moved in 1990 to 1994 (%)
Year householder moved into unit - Moved in 1990 to 1994 (%) - White
Year householder moved into unit - Moved in 1990 to 1994 (%) - Black or African American
Year householder moved into unit - Moved in 1990 to 1994 (%) - Asian
Year householder moved into unit - Moved in 1990 to 1994 (%) - Hispanic or Latino
Year householder moved into unit - Moved in 1990 to 1994 (%) - American Indian and Alaska Native
Year householder moved into unit - Moved in 1990 to 1994 (%) - Multirace
Year householder moved into unit - Moved in 1990 to 1994 (%) - Other Race
Year householder moved into unit - Moved in 1980 to 1989 (%)
Year householder moved into unit - Moved in 1980 to 1989 (%) - White
Year householder moved into unit - Moved in 1980 to 1989 (%) - Black or African American
Year householder moved into unit - Moved in 1980 to 1989 (%) - Asian
Year householder moved into unit - Moved in 1980 to 1989 (%) - Hispanic or Latino
Year householder moved into unit - Moved in 1980 to 1989 (%) - American Indian and Alaska Native
Year householder moved into unit - Moved in 1980 to 1989 (%) - Multirace
Year householder moved into unit - Moved in 1980 to 1989 (%) - Other Race
Year householder moved into unit - Moved in 1970 to 1979 (%)
Year householder moved into unit - Moved in 1970 to 1979 (%) - White
Year householder moved into unit - Moved in 1970 to 1979 (%) - Black or African American
Year householder moved into unit - Moved in 1970 to 1979 (%) - Asian
Year householder moved into unit - Moved in 1970 to 1979 (%) - Hispanic or Latino
Year householder moved into unit - Moved in 1970 to 1979 (%) - American Indian and Alaska Native
Year householder moved into unit - Moved in 1970 to 1979 (%) - Multirace
Year householder moved into unit - Moved in 1970 to 1979 (%) - Other Race
Year householder moved into unit - Moved in 1969 or earlier (%)
Year householder moved into unit - Moved in 1969 or earlier (%) - White
Year householder moved into unit - Moved in 1969 or earlier (%) - Black or African American
Year householder moved into unit - Moved in 1969 or earlier (%) - Asian
Year householder moved into unit - Moved in 1969 or earlier (%) - Hispanic or Latino
Year householder moved into unit - Moved in 1969 or earlier (%) - American Indian and Alaska Native
Year householder moved into unit - Moved in 1969 or earlier (%) - Multirace
Year householder moved into unit - Moved in 1969 or earlier (%) - Other Race
Housing units lacking complete plumbing facilities (%)
Housing units lacking complete kitchen facilities (%)
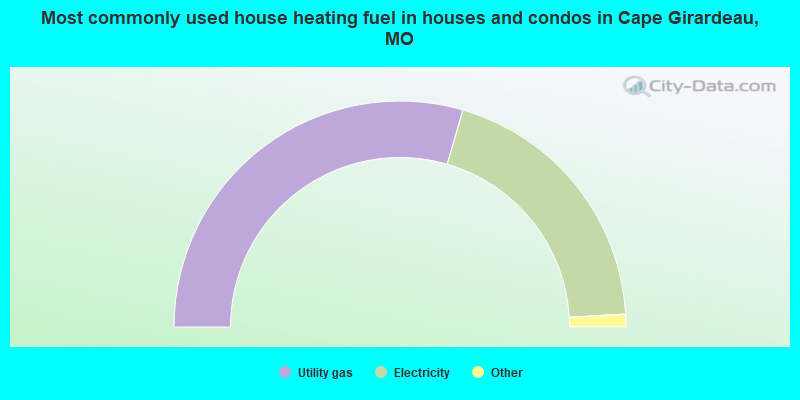
House heating fuel used in houses and condos - Utility gas (%)
House heating fuel used in houses and condos - Bottled, tank, or LP gas (%)
House heating fuel used in houses and condos - Electricity (%)
House heating fuel used in houses and condos - Fuel oil, kerosene, etc. (%)
House heating fuel used in houses and condos - Coal or coke (%)
House heating fuel used in houses and condos - Wood (%)
House heating fuel used in houses and condos - Solar energy (%)
House heating fuel used in houses and condos - Other fuel (%)
House heating fuel used in houses and condos - No fuel used (%)
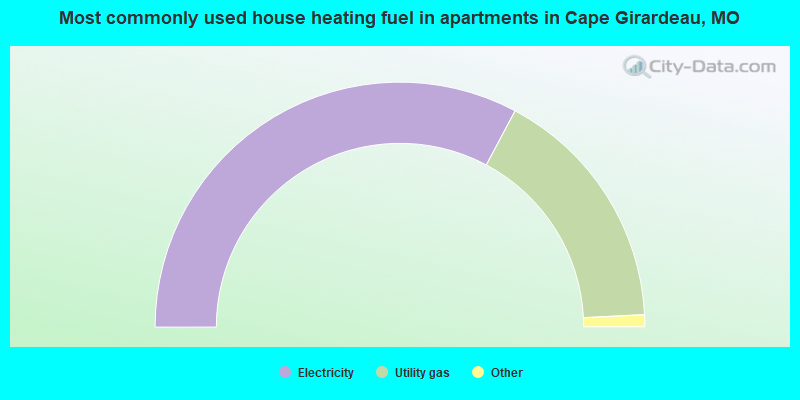
House heating fuel used in apartments - Utility gas (%)
House heating fuel used in apartments - Bottled, tank, or LP gas (%)
House heating fuel used in apartments - Electricity (%)
House heating fuel used in apartments - Fuel oil, kerosene, etc. (%)
House heating fuel used in apartments - Coal or coke (%)
House heating fuel used in apartments - Wood (%)
House heating fuel used in apartments - Solar energy (%)
House heating fuel used in apartments - Other fuel (%)
House heating fuel used in apartments - No fuel used (%)
Median year house/condo built: 1977Median year apartment built: 1975Household type by relationship:
Households: 40,377
Male householders: 7,664 (2,427 living alone ), Female householders: 8,432 (3,479 living alone )6,233 spouses (6,180 opposite-sex spouses ), 1,496 unmarried partners , (1,286 opposite-sex unmarried partners ), 9,191 children (8,408 natural , 220 adopted , 563 stepchildren ), 524 grandchildren , 237 brothers or sisters , 255 parents , 31 foster children , 240 other relatives , 2,878 non-relatives In group quarters: 3,190
Size of family households: 4,869 2-persons , 1,824 3-persons , 1,524 4-persons , 448 5-persons , 76 6-persons , 132 7-or-more-persons .
Size of nonfamily households: 5,242 1-person , 1,608 2-persons , 337 3-persons , 216 4-persons , 55 5-persons , 43 7-or-more-persons .
3,577 married couples with children. single-parent households (289 men , 1,864 women ).
94.0% of residents of Cape Girardeau speak English at home. of residents speak Spanish at home (80% speak English very well , 11% speak English well , 9% speak English not well ).of residents speak other Indo-European language at home (80% speak English very well , 19% speak English well , 1% don't speak English at all ).of residents speak Asian or Pacific Island language at home (26% speak English very well , 62% speak English well , 6% speak English not well , 6% don't speak English at all ).of residents speak other language at home (66% speak English very well , 34% speak English well ).
Foreign born population: 1,760 (4.4%)of them are naturalized citizens )
Median number of rooms in houses and condos:
Median number of rooms in apartments
Owner-occupied Renter-occupied
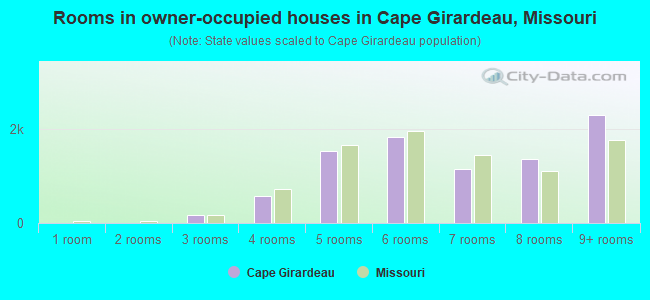
Rooms in owner-occupied houses in Cape Girardeau, Missouri
0 1 room 0 2 rooms 180 3 rooms 574 4 rooms 1,526 5 rooms 1,828 6 rooms 1,156 7 rooms 1,363 8 rooms 2,304 9+ rooms
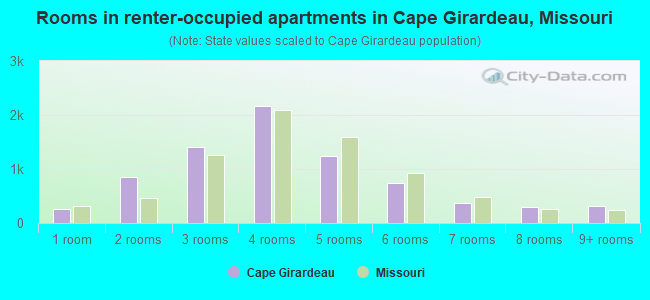
Rooms in renter-occupied apartments in Cape Girardeau, Missouri
268 1 room 848 2 rooms 1,411 3 rooms 2,159 4 rooms 1,234 5 rooms 740 6 rooms 369 7 rooms 305 8 rooms 318 9+ rooms
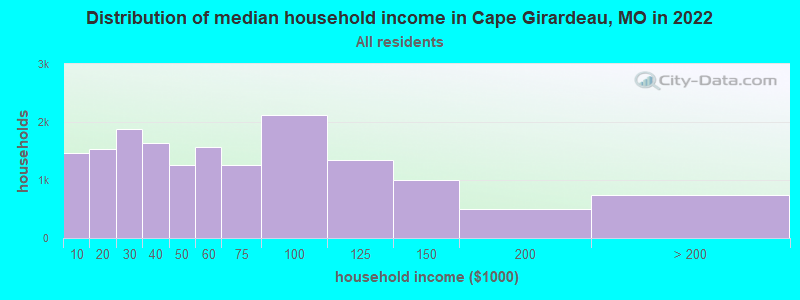
Cape Girardeau, MO household income distribution 1,460 Less than $10,0001,539 $10,000 to $19,9991,886 $20,000 to $29,9991,631 $30,000 to $39,9991,261 $40,000 to $49,9991,562 $50,000 to $59,9991,262 $60,000 to $74,9992,125 $75,000 to $99,9991,344 $100,000 to $124,999998 $125,000 to $149,999500 $150,000 to $199,999741 $200,000 or more
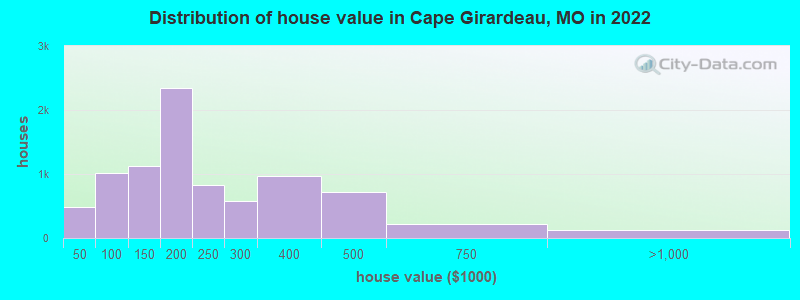
Home value of owner - occupied houses in 2022 in Cape Girardeau, MO 153 Less than $10,000113 $15,000 to $19,99916 $20,000 to $24,99916 $25,000 to $29,99938 $30,000 to $34,99924 $35,000 to $39,999120 $40,000 to $49,99961 $50,000 to $59,99936 $60,000 to $69,999128 $70,000 to $79,999454 $80,000 to $89,999218 $90,000 to $99,999602 $100,000 to $124,999525 $125,000 to $149,9991,320 $150,000 to $174,9991,019 $175,000 to $199,999829 $200,000 to $249,999579 $250,000 to $299,999968 $300,000 to $399,999714 $400,000 to $499,999220 $500,000 to $749,99993 $750,000 to $999,99933 $1,000,000 to $1,499,999Rent paid by renters in 2022 in Cape Girardeau, MO 20 Less than $10042 $100 to $149133 $150 to $19937 $200 to $24976 $250 to $299185 $300 to $349141 $350 to $399231 $400 to $449368 $450 to $499456 $500 to $5491,501 $550 to $599603 $600 to $649275 $650 to $699517 $700 to $74997 $750 to $799542 $800 to $899320 $900 to $999775 $1,000 to $1,249466 $1,250 to $1,499133 $1,500 to $1,99911 $2,000 to $2,49925 $3,000 to $3,49927 $3,500 or more249 No cash rent
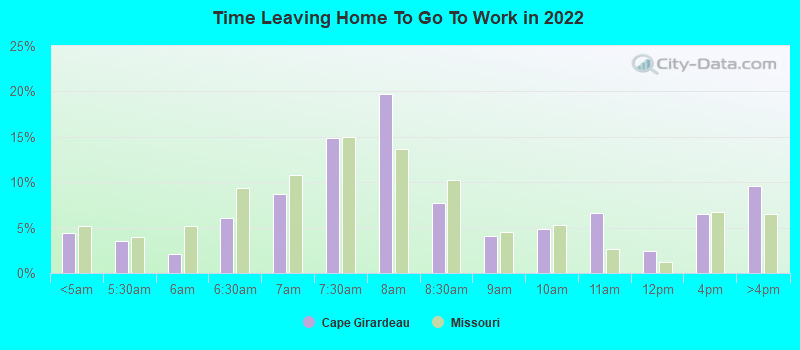
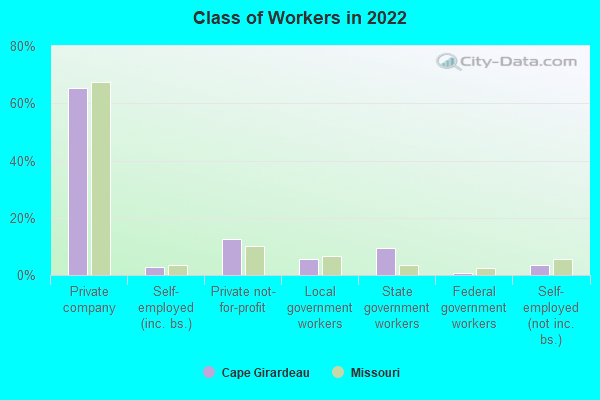
Percentage of workers working in this county: 86.1%Number of people working at home: 1,531 (7.8% of all workers )
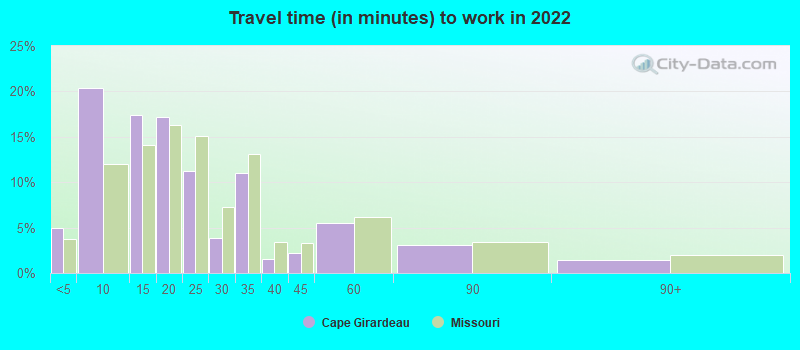
Travel time to work (commute)
Less than 5 minutes: 8595 to 9 minutes: 5,31810 to 14 minutes: 4,43815 to 19 minutes: 2,52920 to 24 minutes: 1,45625 to 29 minutes: 25630 to 34 minutes: 82135 to 39 minutes: 17940 to 44 minutes: 15145 to 59 minutes: 95860 to 89 minutes: 74790 or more minutes: 152
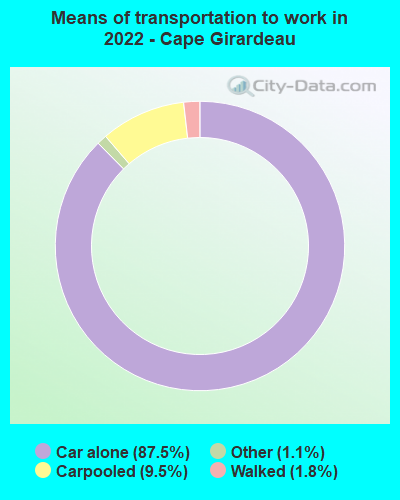
Means of transportation to work:
Drove a car alone: 23,962 (81.4%)Carpooled: 2,627 (8.9%)Bus : 11 (0.0%)Taxi: 301 (1.0%)Bicycle: 26 (0.1%)Walked: 460 (1.6%)Worked at home: 1,531 (5.2%)
Unemployment by race in 2022
Unemployment rate for White non-Hispanic residents 2.0% Males0.7% FemalesUnemployment rate for Black residents 1.9% Males8.5% FemalesUnemployment rate for two or more race residents 19.0% Males9.2% Females
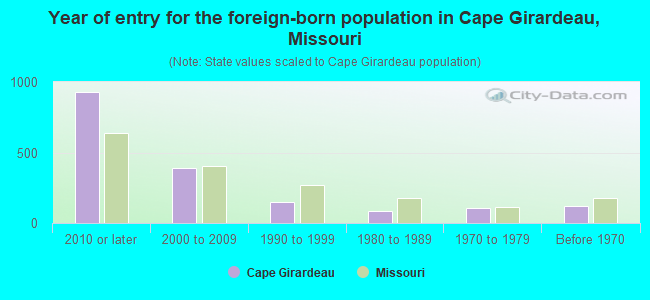
Year of entry for the foreign-born population in Cape Girardeau, Missouri
929 2010 or later 389 2000 to 2009 152 1990 to 1999 82 1980 to 1989 103 1970 to 1979 120 Before 1970
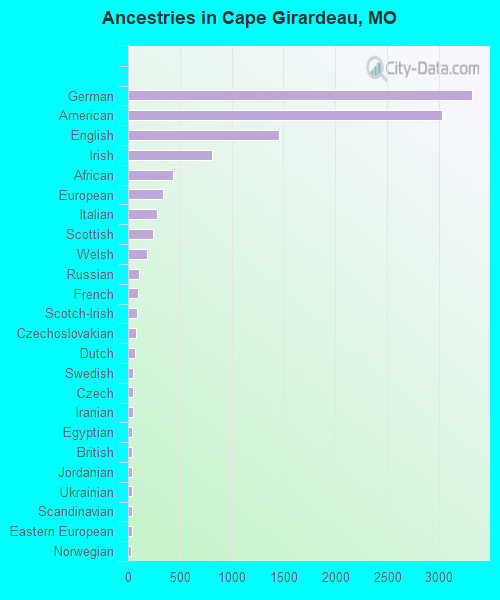
First ancestries reported:
German: 3,317 (19.7%)
American: 3,025 (17.9%)
English: 1,455 (8.6%)
Irish: 814 (4.8%)
African: 436 (2.6%)
European: 337 (2.0%)
Italian: 276 (1.6%)
Scottish: 241 (1.4%)
Welsh: 184 (1.1%)
Russian: 107 (0.6%)
French: 98 (0.6%)
Scotch-Irish: 84 (0.5%)
Czechoslovakian: 79 (0.5%)
Dutch: 67 (0.4%)
Swedish: 53 (0.3%)
Czech: 50 (0.3%)
Iranian: 45 (0.3%)
Egyptian: 41 (0.2%)
British: 41 (0.2%)
Jordanian: 40 (0.2%)
Ukrainian: 39 (0.2%)
Scandinavian: 38 (0.2%)
Eastern European: 35 (0.2%)
Norwegian: 33 (0.2%)
Nigerian: 28 (0.2%)
Romanian: 18 (0.1%)
Northern European: 14 (0.08%)
Polish: 10 (0.06%)
Bulgarian: 9 (0.05%)
Macedonian: 5 (0.03%)
Lithuanian: 4 (0.02%)
Serbian: 4 (0.02%) Most common places of birth for foreign-born residents (%): China, excluding Hong Kong and Taiwan Cape Girardeau:
21.5% (329)Missouri:
6.6% (17,002)
Mexico Cape Girardeau:
12.6% (193)Missouri:
14.9% (38,568)
Japan Cape Girardeau:
10.7% (164)Missouri:
0.7% (1,818)
Russia Cape Girardeau:
7.9% (121)Missouri:
1.5% (3,767)
Bangladesh Cape Girardeau:
6.2% (95)Missouri:
0.5% (1,194)
India Cape Girardeau:
4.3% (65)Missouri:
8.9% (22,932)
Nigeria Cape Girardeau:
2.9% (44)Missouri:
1.4% (3,640)
Ukraine Cape Girardeau:
2.6% (40)Missouri:
1.1% (2,895)
Vietnam Cape Girardeau:
2.6% (40)Missouri:
4.1% (10,700)
Kuwait Cape Girardeau:
2.2% (34)Missouri:
0.2% (406)
Nepal Cape Girardeau:
2.2% (34)Missouri:
0.5% (1,214)
Guatemala Cape Girardeau:
2.2% (34)Missouri:
2.8% (7,146)
Colombia Cape Girardeau:
2.0% (30)Missouri:
1.2% (2,988)
Germany Cape Girardeau:
1.9% (29)Missouri:
3.0% (7,803)
Egypt Cape Girardeau:
1.8% (28)Missouri:
0.4% (1,143)
Burma (Myanmar) Cape Girardeau:
1.6% (25)Missouri:
0.5% (1,247)
Place of birth for U.S.-born residents:
This state: 25,598Other state: 13,286Northeast: 483Midwest: 5,903South: 5,317West: 1,621 82.3% of Cape Girardeau residents lived in the same house 1 years ago.
Out of people who lived in different houses, 32.2% lived in this county.
Out of people who lived in different counties, 48.4% lived in Missouri.
Cape Girardeau:
82.3%State average:
87.1%
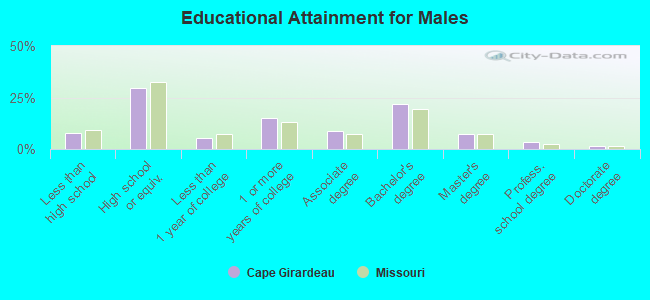
Education attainment for males 25 years and older:
No schooling: 166Nursery to 4th grade: 135th and 6th grade: 77th and 8th grade: 2739th grade: 12110th grade: 13811th grade: 12212th grade, no diploma: 70High school graduate (or equivalency): 3,540Less than 1 year of college: 636Some college more than 1 year, no degree: 1,808Associate degree: 1,022Bachelor's degree: 2,583Master's degree: 878Professional school degree: 389Doctorate degree: 169
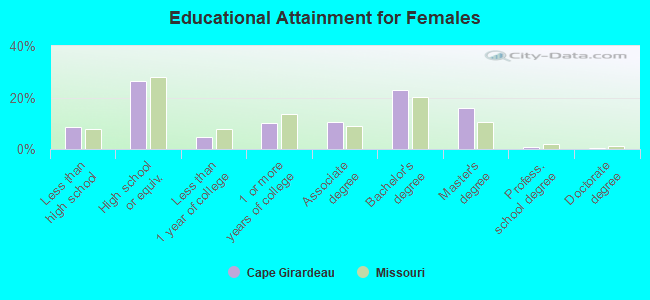
Education attainment for females 25 years and older:
No schooling: 123Nursery to 4th grade: 05th and 6th grade: 677th and 8th grade: 1389th grade: 7010th grade: 25111th grade: 27212th grade, no diploma: 179High school graduate (or equivalency): 3,478Less than 1 year of college: 601Some college more than 1 year, no degree: 1,353Associate degree: 1,370Bachelor's degree: 3,021Master's degree: 2,076Professional school degree: 85Doctorate degree: 75
Housing units in structures:
One, detached: 11,697One, attached: 551Two: 1,1033 or 4: 1,0585 to 9: 1,68510 to 19: 1,33720 to 49: 51750 or more: 330Mobile homes: 331Median worth of mobile homes: $33,210
Housing units lacking complete plumbing facilities in 2022: 1.9%Housing units lacking complete kitchen facilities in 2022: 1.5%House/condo owner moved in on average 12 years ago
Renter moved in on average 3 years ago
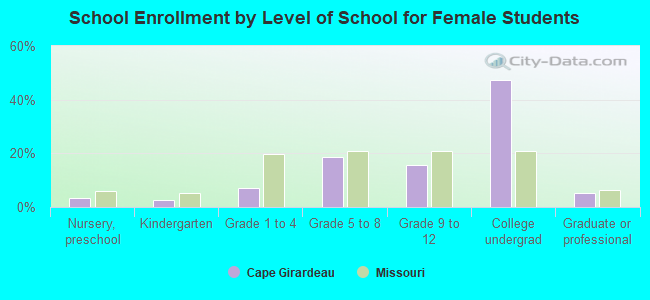
Private vs. public school enrollment:
Students in private schools in grades 1 to 8 (elementary and middle school): 764 Students in private schools in grades 9 to 12 (high school): 377 Students in private undergraduate colleges: 125