Crystal Springs, MS (Mississippi) Houses and Residents
| Crystal Springs: | $75,224 |
| Mississippi: | $162,500 |
Mean price in 2022:
Detached houses: $136,312
Here: $136,312 State: $226,494 Mobile homes: $65,570
Here: $65,570 State: $73,695
Total population: 4,958 (All urban)
Houses: 1,978 (1,760 occupied: 1,246 owner occupied, 532 renter occupied)
| % of renters here: | 30% |
| State: | 30% |
Housing density: 367 houses/condos per square mile
Median price asked for vacant for-sale houses and condos in 2022: $316,116.
Median contract rent in 2022: $483 (lower quartile is $312, upper quartile is $721)
Median rent asked for vacant for-rent units in 2022: $722
Median gross rent in Crystal Springs, MS in 2022: $714
Housing units in Crystal Springs with a mortgage: 656 (0 second mortgage, 0 home equity loan, 0 both second mortgage and home equity loan)
Houses without a mortgage: 0
Median household income for houses/condos with a mortgage: $80,370
Median household income for apartments without a mortgage: $45,388
Median monthly housing costs: $708
Compare current foreclosures in Crystal Springs, MS:
| Photo | Address | Area | Beds / Baths | Price | Details |
|---|---|---|---|---|---|

|
#1
Dry Grove Rd
Crystal Springs, MS 39059
|
4,049 sq. feet
|
3 baths 3 beds |
$174,900
|
show details |

|
#2
W Georgetown St
Crystal Springs, MS 39059
|
- sq. feet
|
2 baths 4 beds |
$149,000
|
show details |

|
#3
Carrie Ave
Crystal Springs, MS 39059
|
1,225 sq. feet
|
1 baths 3 beds |
show details | |

|
#4
Harris St
Crystal Springs, MS 39059
|
864 sq. feet
|
- baths 3 beds |
show details | |

|
#5
Neal Ln
Crystal Springs, MS 39059
|
1,288 sq. feet
|
- baths 3 beds |
show details | |

|
#6
N Bennett St
Crystal Springs, MS 39059
|
2,834 sq. feet
|
1 baths - beds |
show details | |

|
#7
Rhymes Rd
Crystal Springs, MS 39059
|
2,128 sq. feet
|
- baths 3 beds |
show details | |

|
#8
Pearl St
Crystal Springs, MS 39059
|
1,644 sq. feet
|
1 baths - beds |
show details | |

|
#9
Terry Gatesville Rd
Crystal Springs, MS 39059
|
1,152 sq. feet
|
- baths 3 beds |
show details | |

|
#10
Mathis Rd
Crystal Springs, MS 39059
|
2,997 sq. feet
|
1 baths - beds |
show details |
| Photo | Address | Area | Beds / Baths | Price | Details |
|---|---|---|---|---|---|

|
#11
Jefferson Sr Dr
Crystal Springs, MS 39059
|
3,838 sq. feet
|
- baths 3 beds |
show details | |

|
#12
Thomas Rd
Crystal Springs, MS 39059
|
1,964 sq. feet
|
1 baths - beds |
show details | |

|
#13
Taylor Rd
Crystal Springs, MS 39059
|
1,240 sq. feet
|
1 baths - beds |
show details | |

|
#14
Argenville Ln
Crystal Springs, MS 39059
|
- sq. feet
|
- baths - beds |
show details | |

|
#15
Experiment Station Rd
Crystal Springs, MS 39059
|
- sq. feet
|
- baths - beds |
show details | |

|
#16
Bethesda Rd
Crystal Springs, MS 39059
|
- sq. feet
|
- baths - beds |
show details | |

|
#17
Shiloh Run Dr
Crystal Springs, MS 39059
|
- sq. feet
|
- baths - beds |
show details | |

|
#18
Lee Ave
Crystal Springs, MS 39059
|
- sq. feet
|
- baths - beds |
show details | |

|
#19
Janet St
Crystal Springs, MS 39059
|
1,026 sq. feet
|
- baths - beds |
show details | |

|
#20
Tank Rd
Crystal Springs, MS 39059
|
- sq. feet
|
- baths - beds |
show details |
| Photo | Address | Area | Beds / Baths | Price | Details |
|---|---|---|---|---|---|

|
#21
Churchill St
Crystal Springs, MS 39059
|
- sq. feet
|
- baths - beds |
show details | |

|
#22
E Gallman Rd
Crystal Springs, MS 39059
|
- sq. feet
|
- baths - beds |
show details | |

|
#23
Sumrall Rd
Crystal Springs, MS 39059
|
- sq. feet
|
- baths - beds |
show details | |

|
#24
Lincoln St
Crystal Springs, MS 39059
|
1,216 sq. feet
|
- baths - beds |
show details | |

|
#25
Camp St
Crystal Springs, MS 39059
|
660 sq. feet
|
- baths - beds |
show details | |

|
#26
Johnson Rd
Crystal Springs, MS 39059
|
- sq. feet
|
- baths - beds |
show details | |

|
#27
Cumberland Dr Apt G51
Crystal Springs, MS 39059
|
- sq. feet
|
- baths - beds |
show details | |

|
#28
Mitchell Rd
Crystal Springs, MS 39059
|
- sq. feet
|
- baths - beds |
show details | |

|
#29
Experiment Station Rd
Crystal Springs, MS 39059
|
960 sq. feet
|
- baths - beds |
show details | |

|
#30
Glasper Ln
Crystal Springs, MS 39059
|
- sq. feet
|
- baths - beds |
show details |
| Photo | Address | Area | Beds / Baths | Price | Details |
|---|---|---|---|---|---|

|
#31
Susanne Cir
Crystal Springs, MS 39059
|
1,118 sq. feet
|
- baths - beds |
show details | |

|
#32
E Church St
Crystal Springs, MS 39059
|
- sq. feet
|
- baths - beds |
show details | |

|
#33
Liberty St
Crystal Springs, MS 39059
|
924 sq. feet
|
- baths - beds |
show details | |

|
#34
Lee Ave
Crystal Springs, MS 39059
|
1,229 sq. feet
|
- baths - beds |
show details | |

|
#35
Brushy Creek Rd
Crystal Springs, MS 39059
|
- sq. feet
|
- baths - beds |
show details | |

|
#36
Bankhead Ln
Crystal Springs, MS 39059
|
1,160 sq. feet
|
- baths - beds |
show details | |

|
#37
Kendall Ln
Crystal Springs, MS 39059
|
- sq. feet
|
- baths - beds |
show details | |

|
#38
Tucker St
Crystal Springs, MS 39059
|
- sq. feet
|
- baths - beds |
show details | |

|
#39
Purvis Dr
Crystal Springs, MS 39059
|
1,067 sq. feet
|
- baths - beds |
show details | |

|
#40
Mitchell Rd
Crystal Springs, MS 39059
|
912 sq. feet
|
- baths - beds |
show details |
| Photo | Address | Area | Beds / Baths | Price | Details |
|---|---|---|---|---|---|

|
#41
Alford Rd
Crystal Springs, MS 39059
|
- sq. feet
|
- baths - beds |
show details | |

|
#42
Highland St
Crystal Springs, MS 39059
|
1,035 sq. feet
|
- baths - beds |
show details | |

|
#43
Brushy Creek Rd # A
Crystal Springs, MS 39059
|
- sq. feet
|
- baths - beds |
show details | |

|
#44
Tank Rd
Crystal Springs, MS 39059
|
- sq. feet
|
- baths - beds |
show details | |

|
Check over 1 million property listings on Foreclosure.com!
|
browse all offers | |||


Median year apartment built: 1991
Household type by relationship:
Households: 4,789- Male householders: 868 (421 living alone), Female householders: 857 (171 living alone)
571 spouses (557 opposite-sex spouses), 93 unmarried partners, (93 opposite-sex unmarried partners), 1,795 children (1,748 natural, 15 adopted, 30 stepchildren), 30 grandchildren, 250 brothers or sisters, 133 parents, 0 foster children, 69 other relatives, 47 non-relatives
- In group quarters: 71
Size of family households: 338 2-persons, 409 3-persons, 207 4-persons, 118 5-persons.
Size of nonfamily households: 622 1-person, 81 2-persons.
286 married couples with children.
713 single-parent households (61 men, 652 women).
94.2% of residents of Crystal Springs speak English at home.
5.8% of residents speak Spanish at home (71% speak English very well, 17% speak English well, 12% don't speak English at all).
Foreign born population: 173 (3.6%)
(76.9% of them are naturalized citizens)
| Here: | 5.6 |
| State: | 6.3 |
| Here: | 5.2 |
| State: | 4.8 |

- Bedrooms in owner-occupied houses and condos in Crystal Springs, Mississippi
- 0no bedroom
- 341 bedroom
- 2452 bedrooms
- 6813 bedrooms
- 2834 bedrooms
- 45+ bedrooms

- Bedrooms in renter-occupied apartments in Crystal Springs, Mississippi
- 0no bedroom
- 771 bedroom
- 1672 bedrooms
- 1893 bedrooms
- 784 bedrooms
- 225+ bedrooms

- Cars and other vehicles available in Crystal Springs in owner-occupied houses/condos
- 83no vehicle
- 4371 vehicle
- 4912 vehicles
- 1433 vehicles
- 264 vehicles
- 675+ vehicles

- Cars and other vehicles available in Crystal Springs in renter-occupied apartments
- 92no vehicle
- 1361 vehicle
- 2192 vehicles
- 433 vehicles
- 424 vehicles
- 05+ vehicles

- Rooms in owner-occupied houses in Crystal Springs, Mississippi
- 01 room
- 02 rooms
- 343 rooms
- 1754 rooms
- 3945 rooms
- 2206 rooms
- 1547 rooms
- 1858 rooms
- 849+ rooms

- Rooms in renter-occupied apartments in Crystal Springs, Mississippi
- 01 room
- 672 rooms
- 453 rooms
- 984 rooms
- 935 rooms
- 916 rooms
- 817 rooms
- 08 rooms
- 579+ rooms


Crystal Springs, MS household income distribution

- 226Less than $10,000
- 207$10,000 to $19,999
- 253$20,000 to $29,999
- 118$30,000 to $39,999
- 289$40,000 to $49,999
- 75$50,000 to $59,999
- 62$60,000 to $74,999
- 73$75,000 to $99,999
- 214$100,000 to $124,999
- 83$125,000 to $149,999
- 120$150,000 to $199,999
- 43$200,000 or more

Home value of owner - occupied houses in 2022 in Crystal Springs, MS
-
- 33$15,000 to $19,999
- 32$20,000 to $24,999
- 9$25,000 to $29,999
- 64$30,000 to $34,999
- 13$35,000 to $39,999
- 296$50,000 to $59,999
- 164$60,000 to $69,999
- 54$80,000 to $89,999
- 77$90,000 to $99,999
- 29$100,000 to $124,999
- 112$125,000 to $149,999
- 37$150,000 to $174,999
- 50$175,000 to $199,999
- 86$250,000 to $299,999
- 128$300,000 to $399,999

Rent paid by renters in 2022 in Crystal Springs, MS
-
- 12Less than $100
- 61$150 to $199
- 8$250 to $299
- 62$300 to $349
- 26$350 to $399
- 46$400 to $449
- 19$450 to $499
- 115$500 to $549
- 14$600 to $649
- 48$700 to $749
- 57$900 to $999
- 73No cash rent


Percentage of workers working in this county: 34.5%
Number of people working at home: 43 (2.4% of all workers)

Travel time to work (commute)
- Less than 5 minutes: 4
- 5 to 9 minutes: 90
- 10 to 14 minutes: 144
- 15 to 19 minutes: 298
- 20 to 24 minutes: 227
- 25 to 29 minutes: 47
- 30 to 34 minutes: 114
- 35 to 39 minutes: 83
- 40 to 44 minutes: 255
- 45 to 59 minutes: 327
- 60 to 89 minutes: 100
- 90 or more minutes: 17

Means of transportation to work:
- Drove a car alone: 1,274 (87.7%)
- Carpooled: 124 (8.5%)
- Worked at home: 43 (3.0%)

- Unemployment by race in 2022
- Unemployment rate for White non-Hispanic residents
- 6.0%Females
- Unemployment rate for Black residents
- 5.2%Males
- 3.1%Females

- Year of entry for the foreign-born population in Crystal Springs, Mississippi
- 912010 or later
- 572000 to 2009
- 341990 to 1999
- 01980 to 1989
- 71970 to 1979
- 33Before 1970

First ancestries reported:
- English: 231 (6.4%)
- Irish: 140 (3.9%)
- American: 125 (3.5%)
- German: 49 (1.4%)
- African: 33 (0.9%)
- Scotch-Irish: 28 (0.8%)
- European: 22 (0.6%)
- Italian: 11 (0.3%)
Most common places of birth for foreign-born residents (%):
| Crystal Springs: | 56.5% (104) |
| Mississippi: | 25.4% (17,354) |
| Crystal Springs: | 31.5% (58) |
| Mississippi: | 1.3% (870) |
| Crystal Springs: | 10.9% (20) |
| Mississippi: | 1.4% (941) |
Place of birth for U.S.-born residents:
- This state: 3,890
- Other state: 633
- Northeast: 0
- Midwest: 156
- South: 356
- West: 122
98.2% of Crystal Springs residents lived in the same house 1 years ago.
Out of people who lived in different houses, 8.6% lived in this county.
Out of people who lived in different counties, 44.2% lived in Mississippi.
| Crystal Springs: | 98.2% |
| State average: | 88.9% |
Education attainment for males 25 years and older:
- No schooling: 115
- Nursery to 4th grade: 0
- 5th and 6th grade: 0
- 7th and 8th grade: 98
- 9th grade: 139
- 10th grade: 0
- 11th grade: 103
- 12th grade, no diploma: 10
- High school graduate (or equivalency): 376
- Less than 1 year of college: 52
- Some college more than 1 year, no degree: 294
- Associate degree: 202
- Bachelor's degree: 447
- Master's degree: 7
- Professional school degree: 0
- Doctorate degree: 23

Education attainment for females 25 years and older:
- No schooling: 0
- Nursery to 4th grade: 0
- 5th and 6th grade: 47
- 7th and 8th grade: 42
- 9th grade: 5
- 10th grade: 24
- 11th grade: 0
- 12th grade, no diploma: 73
- High school graduate (or equivalency): 454
- Less than 1 year of college: 137
- Some college more than 1 year, no degree: 228
- Associate degree: 81
- Bachelor's degree: 287
- Master's degree: 131
- Professional school degree: 46
- Doctorate degree: 0


Housing units in structures:
- One, detached: 1,430
- One, attached: 12
- Two: 61
- 3 or 4: 90
- 5 to 9: 12
- Mobile homes: 370
Median worth of mobile homes: $64,809
Housing units lacking complete kitchen facilities in 2022: 7.9%
House/condo owner moved in on average 16 years ago
Renter moved in on average 8 years ago


- 49.3%Electricity
- 46.3%Utility gas
- 3.4%Bottled, tank, or LP gas
- 1.0%Wood
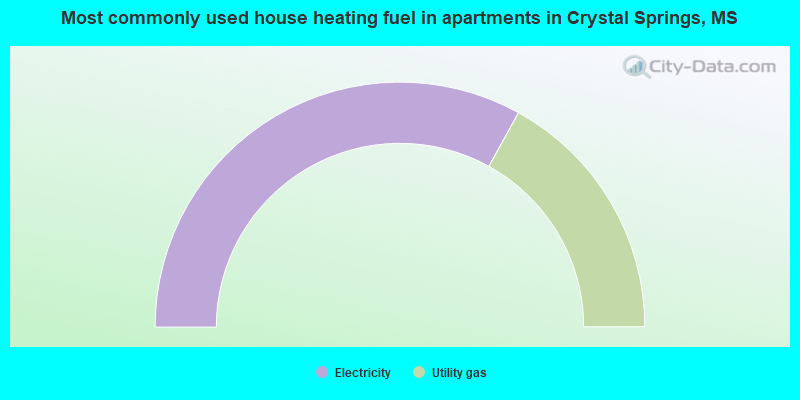
- 69.4%Electricity
- 30.6%Utility gas
Private vs. public school enrollment:
| Here: | 27.7% |
| Mississippi: | 16.1% |
| Here: | 33.1% |
| Mississippi: | 14.6% |
| Here: | 34.2% |
| Mississippi: | 12.8% |


