Dayton, NV (Nevada) Houses and Residents
| Dayton: | $420,629 |
| Nevada: | $434,700 |
Mean price in 2022:
Detached houses: $277,450
Here: $277,450 State: $549,327 Mobile homes: $200,516
Here: $200,516 State: $159,995
Total population: 8,964 (Urban population: 4,169 (all inside urban clusters), Rural population: 1,733 (63 farm, 1,670 nonfarm))
Houses: 6,034 (5,819 occupied: 4,588 owner occupied, 1,221 renter occupied)
| % of renters here: | 21% |
| State: | 40% |
Housing density: 190 houses/condos per square mile
Median price asked for vacant for-sale houses and condos in 2022: $354,977.
Median contract rent in 2022: $1,206 (lower quartile is $963, upper quartile is $1,493)
Median rent asked for vacant for-rent units in 2022: $1,257
Median gross rent in Dayton, NV in 2022: $1,372
Housing units in Dayton with a mortgage: 3,464 (137 second mortgage, 7 home equity loan, 71 both second mortgage and home equity loan)
Houses without a mortgage: 59
Median household income for houses/condos with a mortgage: $97,141
Median household income for apartments without a mortgage: $79,911
Median monthly housing costs: $1,463
Compare current foreclosures in Dayton, NV:
| Photo | Address | Area | Beds / Baths | Price | Details |
|---|---|---|---|---|---|

|
#1
Ophir Ct
Dayton, NV 89403
|
1,440 sq. feet
|
2 baths 3 beds |
show details | |

|
#2
Snake River Way
Dayton, NV 89403
|
1,638 sq. feet
|
2 baths 3 beds |
show details | |

|
#3
Six Mile Canyon Rd
Dayton, NV 89403
|
1,440 sq. feet
|
2 baths 3 beds |
show details | |

|
#4
Misty Way
Dayton, NV 89403
|
1,636 sq. feet
|
2 baths 3 beds |
show details | |

|
#5
Maze Ave
Dayton, NV 89403
|
1,976 sq. feet
|
2 baths 3 beds |
show details | |

|
#6
Sandefer
Dayton, NV 89403
|
1,232 sq. feet
|
2 baths 3 beds |
show details | |

|
#7
Grayhawk Dr
Dayton, NV 89403
|
2,615 sq. feet
|
3 baths 5 beds |
show details | |

|
#8
Cruden Bay Dr
Dayton, NV 89403
|
2,602 sq. feet
|
2 baths 2 beds |
show details | |

|
#9
Port Pl
Dayton, NV 89403
|
1,446 sq. feet
|
2 baths 3 beds |
show details | |

|
#10
Monte Cristo Dr
Dayton, NV 89403
|
1,394 sq. feet
|
2 baths 3 beds |
show details |
| Photo | Address | Area | Beds / Baths | Price | Details |
|---|---|---|---|---|---|

|
#11
Yellow Jacket Rd
Dayton, NV 89403
|
1,800 sq. feet
|
2 baths 3 beds |
show details | |

|
#12
Carson River Dr
Dayton, NV 89403
|
2,204 sq. feet
|
2 baths 3 beds |
show details | |

|
#13
Sugarloaf Dr
Dayton, NV 89403
|
1,876 sq. feet
|
2 baths 3 beds |
show details | |

|
#14
Gold Creek Dr
Dayton, NV 89403
|
2,661 sq. feet
|
3 baths 4 beds |
show details | |

|
#15
Woodlake Cir
Dayton, NV 89403
|
1,730 sq. feet
|
2 baths 3 beds |
show details | |

|
#16
Royal Troon Dr
Dayton, NV 89403
|
1,251 sq. feet
|
2 baths 3 beds |
show details | |

|
#17
Yellow Jacket Rd
Dayton, NV 89403
|
1,440 sq. feet
|
2 baths 3 beds |
show details | |

|
#18
Lakeview Dr
Dayton, NV 89403
|
2,061 sq. feet
|
2 baths 4 beds |
show details | |

|
#19
Gulch Ct
Dayton, NV 89403
|
1,244 sq. feet
|
2 baths 3 beds |
show details | |

|
#20
Occidental Dr
Dayton, NV 89403
|
1,245 sq. feet
|
2 baths 3 beds |
show details |
| Photo | Address | Area | Beds / Baths | Price | Details |
|---|---|---|---|---|---|

|
#21
Yellow Jacket Rd
Dayton, NV 89403
|
1,440 sq. feet
|
2 baths 3 beds |
show details | |

|
#22
Hart St
Dayton, NV 89403
|
910 sq. feet
|
- baths - beds |
show details | |

|
#23
Pony Express Trl Unit B
Dayton, NV 89403
|
- sq. feet
|
- baths - beds |
show details | |

|
#24
Retail Rd
Dayton, NV 89403
|
- sq. feet
|
- baths - beds |
show details | |

|
#25
Us Highway 50 E
Dayton, NV 89403
|
- sq. feet
|
- baths - beds |
show details | |

|
#26
Sutro Springs Rd
Dayton, NV 89403
|
1,716 sq. feet
|
- baths - beds |
show details | |

|
#27
Coral Way
Dayton, NV 89403
|
- sq. feet
|
- baths - beds |
show details | |

|
#28
Catlin St
Dayton, NV 89403
|
- sq. feet
|
- baths - beds |
show details | |

|
#29
Willie Way
Dayton, NV 89403
|
1,128 sq. feet
|
- baths - beds |
show details | |

|
#30
Julie Way
Dayton, NV 89403
|
1,944 sq. feet
|
- baths - beds |
show details |
| Photo | Address | Area | Beds / Baths | Price | Details |
|---|---|---|---|---|---|

|
#31
Schell Creek Dr
Dayton, NV 89403
|
- sq. feet
|
- baths - beds |
show details | |

|
#32
Cosser St
Dayton, NV 89403
|
- sq. feet
|
- baths - beds |
show details | |

|
#33
Mary Ln
Dayton, NV 89403
|
1,660 sq. feet
|
- baths - beds |
show details | |

|
#34
Poppy Ln
Dayton, NV 89403
|
- sq. feet
|
- baths - beds |
show details | |

|
Check over 1 million property listings on Foreclosure.com!
|
browse all offers | |||

Latest news about housing in Dayton, NV collected exclusively by city-data.com from local newspapers, TV, and radio stations

 | homes for sale in area of Ponderosa Pines in Carson city (6 replies) |
| Reno Neighborhoods with Fastest Rising Home Prices (34 replies) |
| Northwest Bound! (483 replies) |
| Do Carson City apartments exist (8 replies) |
| Carson City/Gardnerville-Minden-Genoa/Dayton Real Estate Report by area (20 replies) |
| Reno (81 replies) |

Median year apartment built: 1995
Household type by relationship:
Households: 15,777- Male householders: 2,850 (660 living alone), Female householders: 2,924 (502 living alone)
3,217 spouses (3,116 opposite-sex spouses), 523 unmarried partners, (523 opposite-sex unmarried partners), 4,420 children (4,279 natural, 50 adopted, 91 stepchildren), 605 grandchildren, 99 brothers or sisters, 480 parents, 0 foster children, 424 other relatives, 231 non-relatives
Size of family households: 2,037 2-persons, 505 3-persons, 1,117 4-persons, 461 5-persons, 174 6-persons, 6 7-or-more-persons.
Size of nonfamily households: 1,153 1-person, 371 2-persons, 12 3-persons.
2,060 married couples with children.
601 single-parent households (99 men, 502 women).
82.9% of residents of Dayton speak English at home.
14.3% of residents speak Spanish at home (77% speak English very well, 12% speak English well, 10% speak English not well).
1.2% of residents speak other Indo-European language at home (93% speak English very well, 7% speak English well).
1.6% of residents speak Asian or Pacific Island language at home (87% speak English very well, 5% speak English well, 8% speak English not well).
0.2% of residents speak other language at home (100% speak English very well).
Foreign born population: 1,412 (8.9%)
(48.9% of them are naturalized citizens)
| Here: | 5.9 |
| State: | 6.0 |
| Here: | 5.1 |
| State: | 4.2 |

- Bedrooms in owner-occupied houses and condos in Dayton, Nevada
- 0no bedroom
- 471 bedroom
- 3932 bedrooms
- 2,6713 bedrooms
- 1,2054 bedrooms
- 2725+ bedrooms

- Bedrooms in renter-occupied apartments in Dayton, Nevada
- 0no bedroom
- 961 bedroom
- 3312 bedrooms
- 7033 bedrooms
- 734 bedrooms
- 195+ bedrooms

- Cars and other vehicles available in Dayton in owner-occupied houses/condos
- 90no vehicle
- 9651 vehicle
- 1,7392 vehicles
- 1,0803 vehicles
- 4784 vehicles
- 2375+ vehicles

- Cars and other vehicles available in Dayton in renter-occupied apartments
- 14no vehicle
- 4521 vehicle
- 4732 vehicles
- 2693 vehicles
- 54 vehicles
- 85+ vehicles

- Rooms in owner-occupied houses in Dayton, Nevada
- 01 room
- 02 rooms
- 613 rooms
- 3734 rooms
- 1,2845 rooms
- 1,1406 rooms
- 7347 rooms
- 3728 rooms
- 6259+ rooms

- Rooms in renter-occupied apartments in Dayton, Nevada
- 01 room
- 152 rooms
- 733 rooms
- 2674 rooms
- 4585 rooms
- 2146 rooms
- 1147 rooms
- 248 rooms
- 569+ rooms


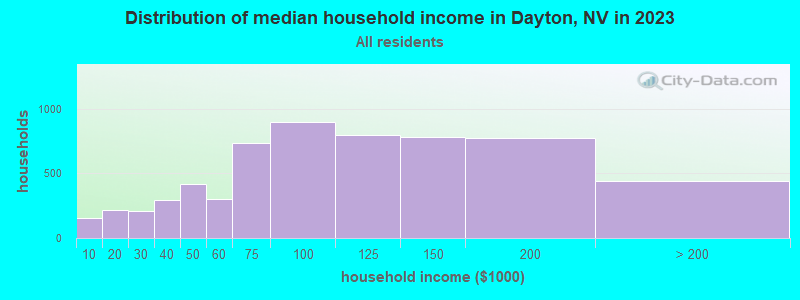
Dayton, NV household income distribution

- 178Less than $10,000
- 143$10,000 to $19,999
- 269$20,000 to $29,999
- 285$30,000 to $39,999
- 384$40,000 to $49,999
- 386$50,000 to $59,999
- 835$60,000 to $74,999
- 940$75,000 to $99,999
- 865$100,000 to $124,999
- 544$125,000 to $149,999
- 664$150,000 to $199,999
- 334$200,000 or more
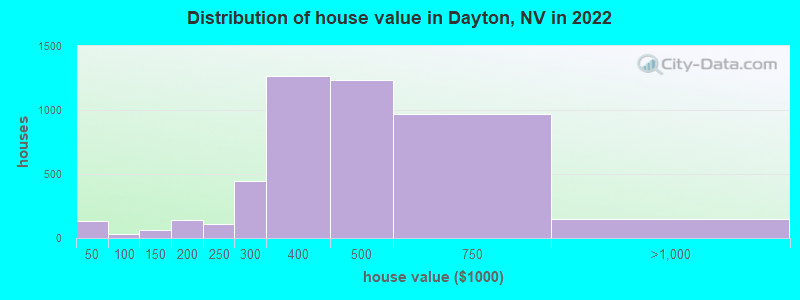
Home value of owner - occupied houses in 2022 in Dayton, NV
-
- 7$10,000 to $14,999
- 41$15,000 to $19,999
- 12$20,000 to $24,999
- 9$25,000 to $29,999
- 63$35,000 to $39,999
- 12$60,000 to $69,999
- 19$80,000 to $89,999
- 41$100,000 to $124,999
- 21$125,000 to $149,999
- 116$150,000 to $174,999
- 21$175,000 to $199,999
- 113$200,000 to $249,999
- 445$250,000 to $299,999
- 1,264$300,000 to $399,999
- 1,234$400,000 to $499,999
- 971$500,000 to $749,999
- 151$750,000 to $999,999
Rent paid by renters in 2022 in Dayton, NV
-
- 21Less than $100
- 24$550 to $599
- 9$600 to $649
- 52$650 to $699
- 8$700 to $749
- 7$750 to $799
- 93$800 to $899
- 95$900 to $999
- 281$1,000 to $1,249
- 247$1,250 to $1,499
- 105$1,500 to $1,999
- 34$3,000 to $3,499
- 103No cash rent


Percentage of workers working in this county: 34.6%
Number of people working at home: 980 (12.5% of all workers)
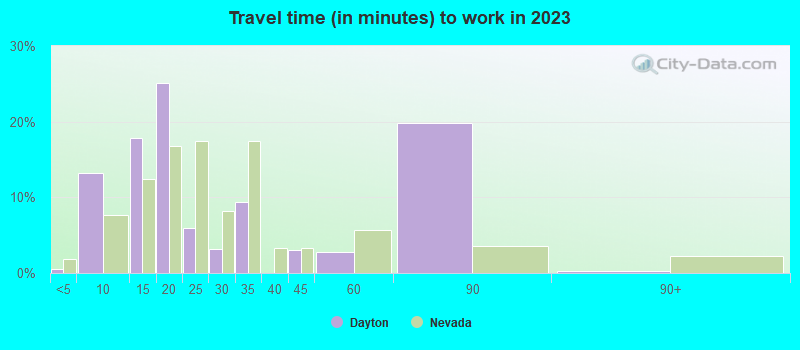
Travel time to work (commute)
- Less than 5 minutes: 50
- 5 to 9 minutes: 214
- 10 to 14 minutes: 596
- 15 to 19 minutes: 796
- 20 to 24 minutes: 1,173
- 25 to 29 minutes: 817
- 30 to 34 minutes: 1,020
- 35 to 39 minutes: 278
- 40 to 44 minutes: 323
- 45 to 59 minutes: 862
- 60 to 89 minutes: 531
- 90 or more minutes: 222
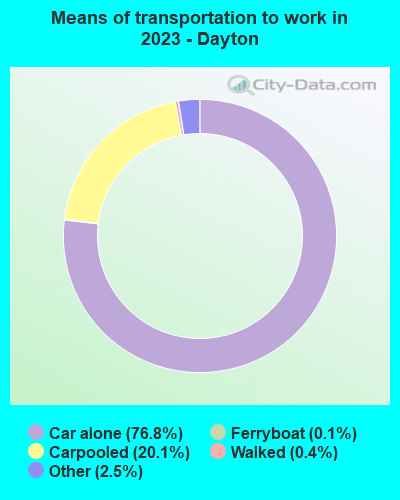
Means of transportation to work:
- Drove a car alone: 1,492 (57.3%)
- Carpooled: 290 (11.1%)
- Ferryboat: 2 (0.1%)
- Taxi: 23 (0.9%)
- Walked: 11 (0.4%)
- Worked at home: 980 (37.6%)

- Unemployment by race in 2022
- Unemployment rate for White non-Hispanic residents
- 5.4%Males
- 8.2%Females
- Unemployment rate for American Indian and Alaska Native residents
- 47.1%Males
- Unemployment rate for Asian residents
- 10.3%Females
- Unemployment rate for two or more race residents
- 39.7%Females
- Unemployment rate for Hispanic or Latino residents
- 14.5%Females

- Year of entry for the foreign-born population in Dayton, Nevada
- 692010 or later
- 3922000 to 2009
- 3121990 to 1999
- 651980 to 1989
- 511970 to 1979
- 119Before 1970

First ancestries reported:
- English: 854 (12.1%)
- German: 752 (10.7%)
- Irish: 658 (9.3%)
- American: 487 (6.9%)
- Italian: 342 (4.9%)
- European: 216 (3.1%)
- Norwegian: 150 (2.1%)
- Russian: 87 (1.2%)
- Scottish: 83 (1.2%)
- Polish: 72 (1.0%)
- Scandinavian: 63 (0.9%)
- Danish: 54 (0.8%)
- Finnish: 48 (0.7%)
- Scotch-Irish: 43 (0.6%)
- Portuguese: 33 (0.5%)
- French: 29 (0.4%)
- Iranian: 20 (0.3%)
- Basque: 17 (0.2%)
- Swedish: 15 (0.2%)
- Czech: 14 (0.2%)
- Hungarian: 14 (0.2%)
- Lithuanian: 14 (0.2%)
- British: 13 (0.2%)
- Dutch: 13 (0.2%)
- Canadian: 12 (0.2%)
- Lebanese: 10 (0.1%)
- Greek: 10 (0.1%)
- Welsh: 10 (0.1%)
- Eastern European: 9 (0.1%)
- French Canadian: 9 (0.1%)
- Arab: 7 (0.10%)
Most common places of birth for foreign-born residents (%):
| Dayton: | 60.6% (856) |
| Nevada: | 36.8% (218,248) |
| Dayton: | 7.7% (109) |
| Nevada: | 4.0% (23,923) |
| Dayton: | 7.1% (100) |
| Nevada: | 0.7% (3,973) |
| Dayton: | 5.3% (75) |
| Nevada: | 15.5% (91,628) |
| Dayton: | 4.0% (57) |
| Nevada: | 0.1% (738) |
| Dayton: | 3.0% (42) |
| Nevada: | 2.0% (11,718) |
| Dayton: | 2.8% (39) |
| Nevada: | 1.1% (6,392) |
| Dayton: | 2.2% (31) |
| Nevada: | 0.9% (5,149) |
| Dayton: | 1.8% (25) |
| Nevada: | 0.9% (5,094) |
Place of birth for U.S.-born residents:
- This state: 4,745
- Other state: 9,348
- Northeast: 914
- Midwest: 1,134
- South: 473
- West: 6,876
90.6% of Dayton residents lived in the same house 1 years ago.
Out of people who lived in different houses, 23.1% lived in this county.
Out of people who lived in different counties, 42.0% lived in Nevada.
| Dayton: | 90.6% |
| State average: | 86.4% |
Education attainment for males 25 years and older:
- No schooling: 108
- Nursery to 4th grade: 0
- 5th and 6th grade: 64
- 7th and 8th grade: 148
- 9th grade: 8
- 10th grade: 156
- 11th grade: 47
- 12th grade, no diploma: 170
- High school graduate (or equivalency): 1,562
- Less than 1 year of college: 609
- Some college more than 1 year, no degree: 1,345
- Associate degree: 697
- Bachelor's degree: 513
- Master's degree: 315
- Professional school degree: 49
- Doctorate degree: 29

Education attainment for females 25 years and older:
- No schooling: 32
- Nursery to 4th grade: 33
- 5th and 6th grade: 68
- 7th and 8th grade: 26
- 9th grade: 15
- 10th grade: 17
- 11th grade: 69
- 12th grade, no diploma: 219
- High school graduate (or equivalency): 1,349
- Less than 1 year of college: 534
- Some college more than 1 year, no degree: 984
- Associate degree: 957
- Bachelor's degree: 1,012
- Master's degree: 179
- Professional school degree: 29
- Doctorate degree: 25


Housing units in structures:
- One, detached: 5,203
- One, attached: 67
- Two: 103
- 3 or 4: 107
- 5 to 9: 153
- 50 or more: 12
- Mobile homes: 387
Median worth of mobile homes: $285,327
Housing units lacking complete kitchen facilities in 2022: 1.1%
House/condo owner moved in on average 8 years ago
Renter moved in on average 4 years ago

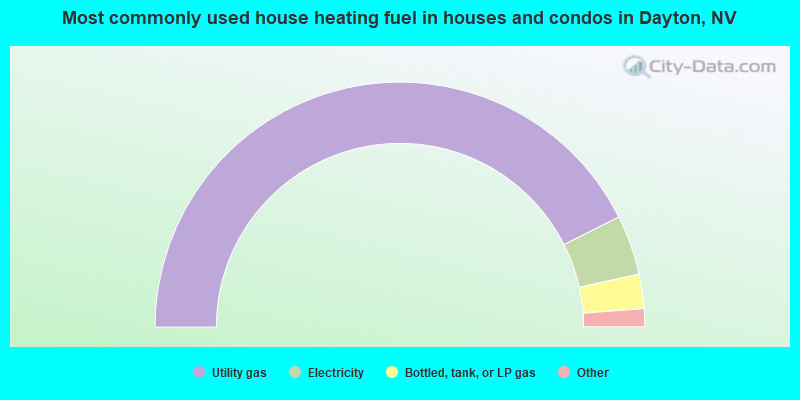
- 85.2%Utility gas
- 7.9%Electricity
- 4.5%Bottled, tank, or LP gas
- 2.1%Other fuel
- 0.3%Wood
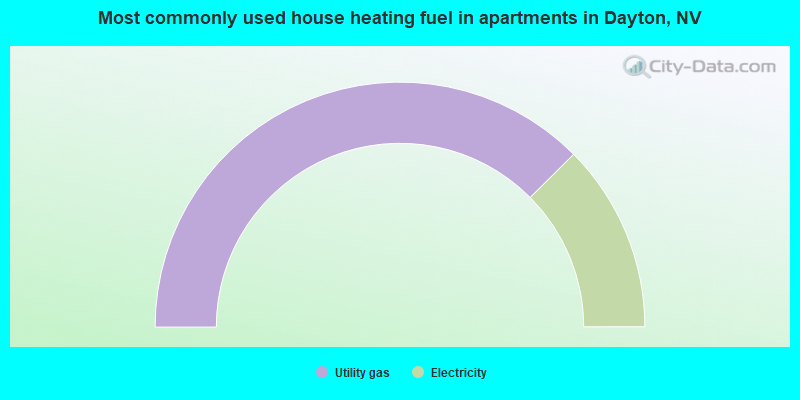
- 75.2%Utility gas
- 24.8%Electricity
Private vs. public school enrollment:
| Here: | 5.9% |
| Nevada: | 12.9% |
| Here: | 5.1% |
| Nevada: | 6.9% |
| Here: | 20.6% |
| Nevada: | 16.0% |


