Elwood, IL (Illinois) Houses and Residents
| Elwood: | $219,203 |
| Illinois: | $251,600 |
Mean price in 2022:
Detached houses: $221,392
Here: $221,392 State: $310,164 Townhouses or other attached units: $210,753
Here: $210,753 State: $286,230 Mobile homes: $64,956
Here: $64,956 State: $78,855
Total population: 2,267 (Urban population: 0, Rural population: 1,635 (4 farm, 1,631 nonfarm))
Houses: 1,006 (949 occupied: 796 owner occupied, 159 renter occupied)
| % of renters here: | 17% |
| State: | 33% |
Housing density: 371 houses/condos per square mile
Median price asked for vacant for-sale houses and condos in 2022 in this county: $222,708.
Median contract rent in 2022: $905 (lower quartile is $719, upper quartile is $1,272)
Median rent asked for vacant for-rent units in 2022: $539
Median gross rent in Elwood, IL in 2022: $1,006
Housing units in Elwood with a mortgage: 497 (26 second mortgage, 3 home equity loan, 12 both second mortgage and home equity loan)
Houses without a mortgage: 6
Median household income for houses/condos with a mortgage: $87,217
Median household income for apartments without a mortgage: $75,480
Median monthly housing costs: $1,283
Compare current foreclosures near Elwood, IL:
| Photo | Address | Area | Beds / Baths | Price | Details |
|---|---|---|---|---|---|

|
#1
Arrowhead Dr
Elwood, IL 60421
|
- sq. feet
|
2 baths - beds |
show details | |

|
#2
N Lincoln St
Elwood, IL 60421
|
- sq. feet
|
- baths - beds |
show details | |

|
#3
Laurel Dr Unit B
Elwood, IL 60421
|
- sq. feet
|
- baths - beds |
show details | |

|
#4
E Bush Dr
Elwood, IL 60421
|
- sq. feet
|
- baths 3 beds |
show details | |

|
#5
W Mississippi St
Elwood, IL 60421
|
- sq. feet
|
- baths - beds |
show details | |

|
#6
James Rd # 227
Elwood, IL 60421
|
- sq. feet
|
- baths - beds |
show details | |

|
#7
N Matteson St
Elwood, IL 60421
|
- sq. feet
|
- baths 3 beds |
show details | |

|
#8
Laurel Dr
Elwood, IL 60421
|
- sq. feet
|
- baths - beds |
show details | |

|
#9
Devonshire Dr
Joliet, IL 60435
|
1,860 sq. feet
|
2 baths 3 beds |
$335,000
|
show details |

|
#10
Laurel Dr
Elwood, IL 60421
|
- sq. feet
|
- baths - beds |
show details |
| Photo | Address | Area | Beds / Baths | Price | Details |
|---|---|---|---|---|---|

|
#11
Cottonwood Dr
Elwood, IL 60421
|
- sq. feet
|
- baths - beds |
show details | |

|
#12
S Chicago Rd
Elwood, IL 60421
|
- sq. feet
|
- baths - beds |
show details | |

|
#13
Redwood Dr
Elwood, IL 60421
|
- sq. feet
|
- baths - beds |
show details | |

|
#14
Ron Ct
Elwood, IL 60421
|
- sq. feet
|
- baths - beds |
show details | |

|
#15
Raymond Dr
Elwood, IL 60421
|
- sq. feet
|
- baths - beds |
show details | |

|
#16
Meadowbrook Rd
Elwood, IL 60421
|
- sq. feet
|
- baths - beds |
show details | |

|
#17
Keith Allen Dr
Elwood, IL 60421
|
- sq. feet
|
- baths - beds |
show details | |

|
#18
Laurel Dr
Elwood, IL 60421
|
- sq. feet
|
- baths - beds |
show details | |

|
#19
Fairfax Ave
Romeoville, IL 60446
|
- sq. feet
|
1 baths 3 beds |
$229,900
|
show details |

|
#20
Capista Dr
Plainfield, IL 60544
|
- sq. feet
|
2 baths 4 beds |
$405,600
|
show details |
| Photo | Address | Area | Beds / Baths | Price | Details |
|---|---|---|---|---|---|

|
#21
Hillgate Rd
Mokena, IL 60448
|
1,844 sq. feet
|
2 baths 3 beds |
show details | |

|
#22
W Juneau Ct
Plainfield, IL 60544
|
1,624 sq. feet
|
4 baths 3 beds |
show details | |

|
#23
Brookshire Dr
Orland Park, IL 60467
|
3,152 sq. feet
|
3 baths 4 beds |
show details | |

|
#24
S Prairie Ave
Joliet, IL 60436
|
2,284 sq. feet
|
1 baths 3 beds |
show details | |

|
#25
Bazz Dr
Plainfield, IL 60586
|
1,532 sq. feet
|
2 baths 4 beds |
show details | |

|
#26
Charleston Ave
Romeoville, IL 60446
|
1,331 sq. feet
|
2 baths 3 beds |
show details | |

|
#27
W Oak Ave
Lockport, IL 60441
|
1,632 sq. feet
|
3 baths 3 beds |
show details | |

|
#28
Jodee Dr
Joliet, IL 60436
|
1,365 sq. feet
|
2 baths 2 beds |
show details | |

|
#29
Healy Ave
Romeoville, IL 60446
|
984 sq. feet
|
1 baths 4 beds |
show details | |

|
#30
Horseshoe Ln
Manhattan, IL 60442
|
3,914 sq. feet
|
2 baths 3 beds |
show details |
| Photo | Address | Area | Beds / Baths | Price | Details |
|---|---|---|---|---|---|

|
#31
Oakton Ave
Romeoville, IL 60446
|
1,720 sq. feet
|
2 baths 3 beds |
show details | |

|
#32
Logan Ridge Dr
Plainfield, IL 60586
|
1,758 sq. feet
|
3 baths 3 beds |
show details | |

|
#33
Hillgate Rd
Mokena, IL 60448
|
1,832 sq. feet
|
1 baths 3 beds |
show details | |

|
#34
Lotus Ln
Crest Hill, IL 60403
|
768 sq. feet
|
2 baths 3 beds |
show details | |

|
#35
Rosewood Ln
Mokena, IL 60448
|
3,194 sq. feet
|
3 baths 4 beds |
show details | |

|
#36
Warren Dorris Dr
Joliet, IL 60435
|
1,744 sq. feet
|
1 baths 3 beds |
show details | |

|
#37
Emery St
Joliet, IL 60436
|
1,460 sq. feet
|
2 baths 3 beds |
show details | |

|
#38
Cambridge Dr
Mokena, IL 60448
|
1,921 sq. feet
|
3 baths 3 beds |
show details | |

|
#39
Liberty Grove Blvd
Plainfield, IL 60544
|
2,430 sq. feet
|
3 baths 4 beds |
show details | |

|
#40
Paul Revere Ln
Plainfield, IL 60544
|
1,495 sq. feet
|
3 baths 2 beds |
show details |
| Photo | Address | Area | Beds / Baths | Price | Details |
|---|---|---|---|---|---|

|
#41
S Reed St
Joliet, IL 60436
|
750 sq. feet
|
2 baths 2 beds |
show details | |

|
#42
Windsor Ln
Joliet, IL 60431
|
1,830 sq. feet
|
2 baths 3 beds |
show details | |

|
#43
Ann St
Joliet, IL 60435
|
1,428 sq. feet
|
2 baths 3 beds |
show details | |

|
#44
Hunter Ave
Joliet, IL 60436
|
1,632 sq. feet
|
2 baths 3 beds |
show details | |

|
#45
Addleman St
Joliet, IL 60431
|
2,304 sq. feet
|
3 baths 4 beds |
show details | |

|
#46
Macon Ave
Romeoville, IL 60446
|
900 sq. feet
|
1 baths 3 beds |
show details | |

|
#47
Lee St
Manhattan, IL 60442
|
1,032 sq. feet
|
2 baths 2 beds |
show details | |

|
#48
Brook Hill Dr
Orland Park, IL 60467
|
3,219 sq. feet
|
3 baths 4 beds |
show details | |

|
#49
W Knollwood Dr
Plainfield, IL 60544
|
1,720 sq. feet
|
3 baths 3 beds |
show details | |

|
Check over 1 million property listings on Foreclosure.com!
|
browse all offers | |||

Latest news about housing in Elwood, IL collected exclusively by city-data.com from local newspapers, TV, and radio stations

 | need apartment between Elwood and Chicago (2 replies) |
| Lowest Taxes in Aurora, Bolingbrook, Naperville (13 replies) |
| Moving to South Suburbs (3 replies) |
| Is Elmwood Park worth moving to? (115 replies) |
| How many suburbs are there? (10 replies) |
| Elwood, IL? (3 replies) |

Median year apartment built: 1984
Household type by relationship:
Households: 2,314- Male householders: 420 (58 living alone), Female householders: 514 (141 living alone)
503 spouses (495 opposite-sex spouses), 99 unmarried partners, (93 opposite-sex unmarried partners), 597 children (559 natural, 14 adopted, 22 stepchildren), 10 grandchildren, 15 brothers or sisters, 15 parents, 0 foster children, 10 other relatives, 122 non-relatives
Size of family households: 318 2-persons, 182 3-persons, 113 4-persons, 28 5-persons, 3 6-persons, 5 7-or-more-persons.
Size of nonfamily households: 206 1-person, 88 2-persons, 21 3-persons.
227 married couples with children.
120 single-parent households (0 men, 120 women).
91.4% of residents of Elwood speak English at home.
3.3% of residents speak Spanish at home (66% speak English very well, 34% speak English well).
2.8% of residents speak other Indo-European language at home (82% speak English very well, 5% speak English well, 13% speak English not well).
1.5% of residents speak other language at home (100% speak English very well).
Foreign born population: 59 (2.5%)
(78.0% of them are naturalized citizens)
| Here: | 6.0 |
| State: | 6.4 |
| Here: | 4.5 |
| State: | 4.1 |

- Bedrooms in owner-occupied houses and condos in Elwood, Illinois
- 0no bedroom
- 61 bedroom
- 1922 bedrooms
- 4923 bedrooms
- 1064 bedrooms
- 05+ bedrooms

- Bedrooms in renter-occupied apartments in Elwood, Illinois
- 0no bedroom
- 291 bedroom
- 792 bedrooms
- 283 bedrooms
- 254 bedrooms
- 05+ bedrooms

- Cars and other vehicles available in Elwood in owner-occupied houses/condos
- 23no vehicle
- 1561 vehicle
- 4332 vehicles
- 1423 vehicles
- 384 vehicles
- 45+ vehicles

- Cars and other vehicles available in Elwood in renter-occupied apartments
- 42no vehicle
- 861 vehicle
- 322 vehicles
- 03 vehicles
- 04 vehicles
- 05+ vehicles

- Rooms in owner-occupied houses in Elwood, Illinois
- 01 room
- 02 rooms
- 03 rooms
- 1184 rooms
- 2065 rooms
- 1426 rooms
- 1707 rooms
- 628 rooms
- 989+ rooms

- Rooms in renter-occupied apartments in Elwood, Illinois
- 01 room
- 292 rooms
- 413 rooms
- 54 rooms
- 495 rooms
- 176 rooms
- 117 rooms
- 08 rooms
- 79+ rooms


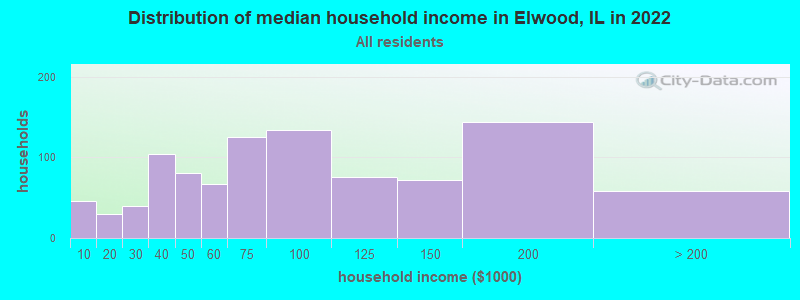
Elwood, IL household income distribution

- 46Less than $10,000
- 30$10,000 to $19,999
- 40$20,000 to $29,999
- 104$30,000 to $39,999
- 81$40,000 to $49,999
- 67$50,000 to $59,999
- 126$60,000 to $74,999
- 134$75,000 to $99,999
- 76$100,000 to $124,999
- 72$125,000 to $149,999
- 144$150,000 to $199,999
- 58$200,000 or more
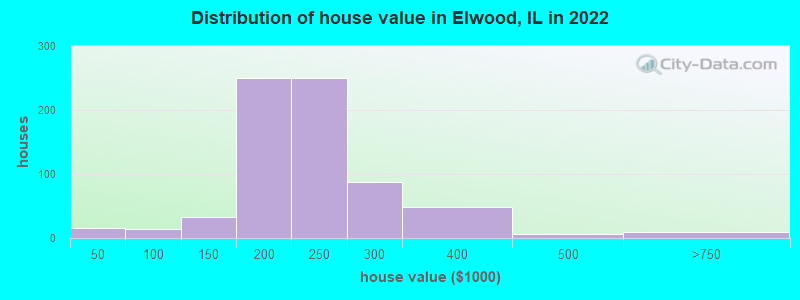
Home value of owner - occupied houses in 2022 in Elwood, IL
-
- 6Less than $10,000
- 2$30,000 to $34,999
- 6$40,000 to $49,999
- 5$60,000 to $69,999
- 1$80,000 to $89,999
- 19$100,000 to $124,999
- 13$125,000 to $149,999
- 72$150,000 to $174,999
- 177$175,000 to $199,999
- 250$200,000 to $249,999
- 86$250,000 to $299,999
- 48$300,000 to $399,999
- 6$400,000 to $499,999
- 9$500,000 to $749,999
Rent paid by renters in 2022 in Elwood, IL
-
- 30$450 to $499
- 52$700 to $749
- 3$800 to $899
- 4$900 to $999
- 34$1,000 to $1,249
- 22$1,500 to $1,999
- 16$2,000 to $2,499
- 9No cash rent


Percentage of workers working in this county: 83.8%
Number of people working at home: 88 (7.1% of all workers)
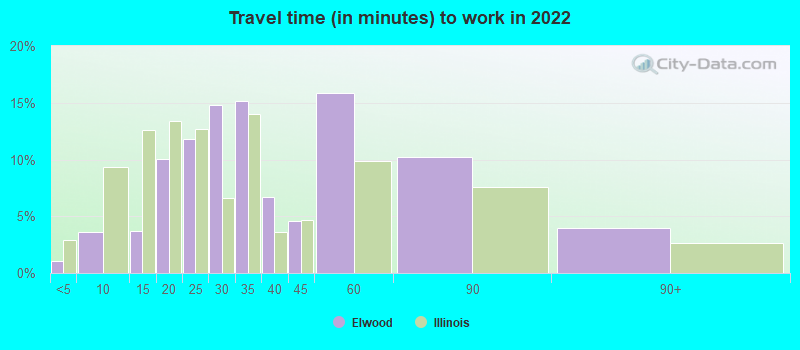
Travel time to work (commute)
- Less than 5 minutes: 26
- 5 to 9 minutes: 84
- 10 to 14 minutes: 110
- 15 to 19 minutes: 158
- 20 to 24 minutes: 204
- 25 to 29 minutes: 106
- 30 to 34 minutes: 127
- 35 to 39 minutes: 41
- 40 to 44 minutes: 60
- 45 to 59 minutes: 87
- 60 to 89 minutes: 81
- 90 or more minutes: 31
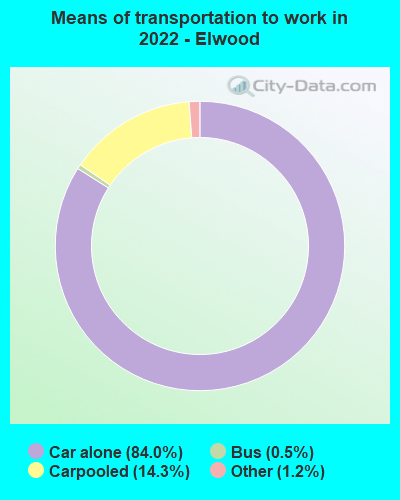
Means of transportation to work:
- Drove a car alone: 2,793 (79.5%)
- Carpooled: 480 (13.7%)
- Bus: 12 (0.3%)
- Taxi: 42 (1.2%)
- Worked at home: 88 (2.5%)

- Unemployment by race in 2022
- Unemployment rate for White non-Hispanic residents
- 4.5%Males
- 0.3%Females

- Year of entry for the foreign-born population in Elwood, Illinois
- 02010 or later
- 412000 to 2009
- 31990 to 1999
- 201980 to 1989
- 21970 to 1979
- 8Before 1970

First ancestries reported:
- German: 180 (16.2%)
- Polish: 169 (15.2%)
- American: 144 (12.9%)
- Irish: 127 (11.4%)
- Liberian: 86 (7.7%)
- Italian: 47 (4.2%)
- English: 44 (4.0%)
- European: 32 (2.9%)
- Dutch: 20 (1.8%)
- Slovene: 10 (0.9%)
- French: 5 (0.4%)
- Slavic: 3 (0.3%)
Most common places of birth for foreign-born residents (%):
| Elwood: | 44.4% (24) |
| Illinois: | 0.0% (615) |
| Elwood: | 18.5% (10) |
| Illinois: | 0.2% (2,731) |
| Elwood: | 18.5% (10) |
| Illinois: | 34.7% (626,958) |
| Elwood: | 11.1% (6) |
| Illinois: | 0.4% (6,611) |
| Elwood: | 7.4% (4) |
| Illinois: | 6.9% (124,474) |
| Elwood: | 7.4% (4) |
| Illinois: | 0.9% (16,553) |
| Elwood: | 7.4% (4) |
| Illinois: | 1.1% (19,306) |
Place of birth for U.S.-born residents:
- This state: 1,966
- Other state: 210
- Northeast: 5
- Midwest: 124
- South: 40
- West: 41
95.3% of Elwood residents lived in the same house 1 years ago.
Out of people who lived in different houses, 48.1% lived in this county.
Out of people who lived in different counties, 100.0% lived in Illinois.
| Elwood: | 95.3% |
| State average: | 88.3% |
Education attainment for males 25 years and older:
- No schooling: 20
- Nursery to 4th grade: 0
- 5th and 6th grade: 0
- 7th and 8th grade: 0
- 9th grade: 0
- 10th grade: 5
- 11th grade: 7
- 12th grade, no diploma: 4
- High school graduate (or equivalency): 457
- Less than 1 year of college: 72
- Some college more than 1 year, no degree: 91
- Associate degree: 86
- Bachelor's degree: 62
- Master's degree: 26
- Professional school degree: 0
- Doctorate degree: 6

Education attainment for females 25 years and older:
- No schooling: 0
- Nursery to 4th grade: 0
- 5th and 6th grade: 10
- 7th and 8th grade: 0
- 9th grade: 0
- 10th grade: 6
- 11th grade: 0
- 12th grade, no diploma: 18
- High school graduate (or equivalency): 306
- Less than 1 year of college: 96
- Some college more than 1 year, no degree: 108
- Associate degree: 178
- Bachelor's degree: 118
- Master's degree: 54
- Professional school degree: 0
- Doctorate degree: 24


Housing units in structures:
- One, detached: 673
- One, attached: 169
- Two: 50
- 3 or 4: 53
- 5 to 9: 5
- 10 to 19: 6
- Mobile homes: 47
Median worth of mobile homes: $81,283
Housing units lacking complete kitchen facilities in 2022: 4.3%
House/condo owner moved in on average 11 years ago
Renter moved in on average 0 years ago

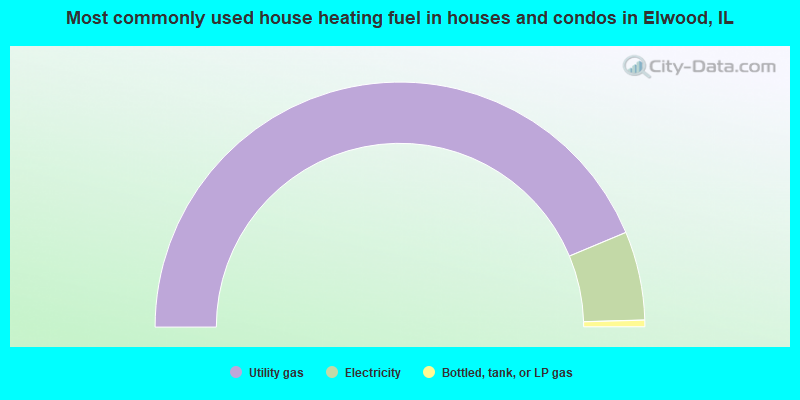
- 87.4%Utility gas
- 11.7%Electricity
- 0.9%Bottled, tank, or LP gas
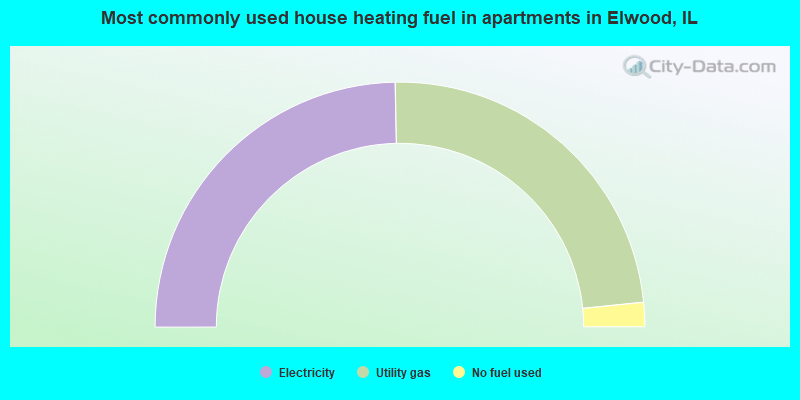
- 49.4%Electricity
- 47.4%Utility gas
- 3.2%No fuel used
Private vs. public school enrollment:
| Here: | 0.0% |
| Illinois: | 13.3% |
| Here: | 0.0% |
| Illinois: | 9.9% |
| Here: | 34.6% |
| Illinois: | 27.4% |


