Ethel, WA (Washington) Houses and Residents
| Ethel: | $432,992 |
| Washington: | $569,500 |
Total population: 2,985 (Urban population: 0, Rural population: 2,780 (17 farm, 2,763 nonfarm))
Houses: 1,143 (1,041 occupied: 813 owner occupied, 228 renter occupied)
| % of renters here: | 22% |
| State: | 36% |
Housing density: 21 houses/condos per square mile
Median price asked for vacant for-sale houses and condos in 2022 in this county: $1,414,732.
Median contract rent in 2022: $655 (lower quartile is $551, upper quartile is $922)
Median rent asked for vacant for-rent units in 2022: $820
Median gross rent in Ethel, WA in 2022: $806
Housing units in Ethel with a mortgage: 196 (12 second mortgage, 20 home equity loan, 0 both second mortgage and home equity loan)
Houses without a mortgage: 117
Compare current foreclosures near Ethel, WA:
| Photo | Address | Area | Beds / Baths | Price | Details |
|---|---|---|---|---|---|

|
#1
State Route 6
Chehalis, WA 98532
|
- sq. feet
|
2 baths 3 beds |
show details | |

|
#2
Schaffran Rd
Castle Rock, WA 98611
|
1,394 sq. feet
|
2 baths 3 beds |
show details | |

|
#3
SW Front St
Winlock, WA 98596
|
1,600 sq. feet
|
3 baths 3 beds |
show details | |

|
#4
G St
Vader, WA 98593
|
1,400 sq. feet
|
2 baths 3 beds |
show details | |

|
#5
Laurel St
Winlock, WA 98596
|
548 sq. feet
|
1 baths 1 beds |
show details | |

|
#6
Cedar Ct
Winlock, WA 98596
|
1,316 sq. feet
|
1 baths 3 beds |
show details | |

|
#7
Tennessee Rd
Winlock, WA 98596
|
1,248 sq. feet
|
2 baths 3 beds |
show details | |

|
#8
SW Kelly Ave
Chehalis, WA 98532
|
2,625 sq. feet
|
2 baths 3 beds |
show details | |

|
#9
Owens Rd
Silverlake, WA 98645
|
2,368 sq. feet
|
2 baths 3 beds |
show details | |

|
#10
NE Franklin Ave
Chehalis, WA 98532
|
1,297 sq. feet
|
1 baths 2 beds |
show details |
| Photo | Address | Area | Beds / Baths | Price | Details |
|---|---|---|---|---|---|

|
#11
Jorgensen Rd
Onalaska, WA 98570
|
1,920 sq. feet
|
2 baths 3 beds |
show details | |

|
#12
Schutt Rd
Castle Rock, WA 98611
|
1,470 sq. feet
|
1 baths 2 beds |
show details | |

|
#13
Elm View Ave
Chehalis, WA 98532
|
1,440 sq. feet
|
2 baths 3 beds |
show details | |

|
#14
Studebaker Pl
Castle Rock, WA 98611
|
1,484 sq. feet
|
1 baths 3 beds |
show details | |

|
#15
Spirit Lake Hwy
Castle Rock, WA 98611
|
1,620 sq. feet
|
2 baths 3 beds |
show details | |

|
#16
Tri Mountain Ln
Centralia, WA 98531
|
1,304 sq. feet
|
1 baths 1 beds |
show details | |

|
#17
Memory Ln
Silverlake, WA 98645
|
1,440 sq. feet
|
2 baths 3 beds |
show details | |

|
#18
Winter Rd
Winlock, WA 98596
|
1,440 sq. feet
|
2 baths - beds |
show details | |

|
#19
N Fork Rd
Chehalis, WA 98532
|
1,200 sq. feet
|
2 baths - beds |
show details | |

|
#20
Hannah Ln
Chehalis, WA 98532
|
1,612 sq. feet
|
2 baths 3 beds |
show details |
| Photo | Address | Area | Beds / Baths | Price | Details |
|---|---|---|---|---|---|

|
#21
Winlock Vader Rd
Winlock, WA 98596
|
1,568 sq. feet
|
2 baths 3 beds |
show details | |

|
#22
SW Grandview Ave
Chehalis, WA 98532
|
2,481 sq. feet
|
1 baths - beds |
show details | |

|
#23
SW 19th St
Chehalis, WA 98532
|
1,299 sq. feet
|
2 baths - beds |
show details | |

|
#24
NW Saint Helens Ave
Chehalis, WA 98532
|
1,680 sq. feet
|
1 baths - beds |
show details | |

|
#25
Barnes Dr
Toledo, WA 98591
|
1,560 sq. feet
|
1 baths - beds |
show details | |

|
#26
Harmon Rd
Chehalis, WA 98532
|
1,536 sq. feet
|
2 baths - beds |
show details | |

|
#27
Saint Michelle Ave
Chehalis, WA 98532
|
1,306 sq. feet
|
2 baths - beds |
show details | |

|
#28
Mosley Rd
Chehalis, WA 98532
|
1,554 sq. feet
|
2 baths - beds |
show details | |

|
#29
Nikula Rd
Winlock, WA 98596
|
1,620 sq. feet
|
2 baths - beds |
show details | |

|
#30
Highway 603
Chehalis, WA 98532
|
1,536 sq. feet
|
2 baths - beds |
show details |
| Photo | Address | Area | Beds / Baths | Price | Details |
|---|---|---|---|---|---|

|
#31
N Military Rd
Winlock, WA 98596
|
1,708 sq. feet
|
1 baths - beds |
show details | |

|
#32
State Route 122
Silver Creek, WA 98585
|
1,767 sq. feet
|
1 baths - beds |
show details | |

|
#33
State Route 505
Toledo, WA 98591
|
4,308 sq. feet
|
4 baths - beds |
show details | |

|
#34
Winter Rd
Winlock, WA 98596
|
1,848 sq. feet
|
2 baths - beds |
show details | |

|
#35
NW Arden Ave
Winlock, WA 98596
|
1,770 sq. feet
|
1 baths - beds |
show details | |

|
#36
NW North St
Chehalis, WA 98532
|
- sq. feet
|
- baths - beds |
show details | |

|
#37
Jackson Hwy
Chehalis, WA 98532
|
- sq. feet
|
- baths - beds |
show details | |

|
#38
N Market Blvd Apt 2
Chehalis, WA 98532
|
- sq. feet
|
- baths - beds |
show details | |

|
#39
NW Prindle St
Chehalis, WA 98532
|
- sq. feet
|
- baths - beds |
show details | |

|
#40
NE Adams Ave
Chehalis, WA 98532
|
- sq. feet
|
- baths - beds |
show details |
| Photo | Address | Area | Beds / Baths | Price | Details |
|---|---|---|---|---|---|

|
#41
Toledo Vader Rd
Toledo, WA 98591
|
- sq. feet
|
1 baths - beds |
show details | |

|
#42
Jackson Hwy
Chehalis, WA 98532
|
- sq. feet
|
- baths - beds |
show details | |

|
#43
Jackson Hwy
Toledo, WA 98591
|
- sq. feet
|
- baths - beds |
show details | |

|
#44
Jackson Hwy
Chehalis, WA 98532
|
- sq. feet
|
- baths - beds |
show details | |

|
#45
Green Mountain Rd
Mossyrock, WA 98564
|
- sq. feet
|
- baths - beds |
show details | |

|
#46
SE Parkhill Dr
Chehalis, WA 98532
|
- sq. feet
|
- baths - beds |
show details | |

|
#47
Peach Rd, Unit A
Winlock, WA 98596
|
- sq. feet
|
- baths - beds |
show details | |

|
#48
SW 11th St
Chehalis, WA 98532
|
- sq. feet
|
- baths - beds |
show details | |

|
#49
State Highway 505
Winlock, WA 98596
|
- sq. feet
|
- baths - beds |
show details | |

|
Check over 1 million property listings on Foreclosure.com!
|
browse all offers | |||

Household type by relationship:
Households: 74,514- In family households: 62,315 (14,631 male householders, 5,473 female householders)
15,241 spouses, 20,171 children (17,964 natural, 698 adopted, 1,509 stepchildren), 1,774 grandchildren, 602 brothers or sisters, 508 parents, foster children, 917 other relatives, 2,553 non-relatives
- In nonfamily households: 12,199 (4,888 male householders (3,616 living alone)), 4,751 female householders (4,028 living alone)), 2,560 nonrelatives
- In group quarters: 941 (689 institutionalized population)
11,774 married couples with children.
4,346 single-parent households (1,292 men, 3,054 women).
96.6% of residents of Ethel speak English at home.
1.7% of residents speak Spanish at home (67% speak English very well, 22% speak English well, 11% speak English not well).
1.4% of residents speak other Indo-European language at home (31% speak English very well, 69% speak English well).
0.3% of residents speak Asian or Pacific Island language at home (100% speak English well).
Foreign born population: 147 (4.2%)
(53.1% of them are naturalized citizens)
| Here: | 6.1 |
| State: | 6.5 |
| Here: | 4.1 |
| State: | 3.9 |

- Bedrooms in owner-occupied houses and condos in Ethel, Washington
- 5no bedroom
- 291 bedroom
- 2002 bedrooms
- 4363 bedrooms
- 1254 bedrooms
- 185+ bedrooms

- Bedrooms in renter-occupied apartments in Ethel, Washington
- 7no bedroom
- 191 bedroom
- 1302 bedrooms
- 653 bedrooms
- 74 bedrooms
- 05+ bedrooms

- Cars and other vehicles available in Ethel in owner-occupied houses/condos
- 14no vehicle
- 1081 vehicle
- 4162 vehicles
- 1863 vehicles
- 774 vehicles
- 125+ vehicles

- Cars and other vehicles available in Ethel in renter-occupied apartments
- 10no vehicle
- 671 vehicle
- 902 vehicles
- 553 vehicles
- 04 vehicles
- 65+ vehicles

- Rooms in owner-occupied houses in Ethel, Washington
- 51 room
- 72 rooms
- 183 rooms
- 1054 rooms
- 2575 rooms
- 1346 rooms
- 1687 rooms
- 608 rooms
- 599+ rooms

- Rooms in renter-occupied apartments in Ethel, Washington
- 71 room
- 142 rooms
- 113 rooms
- 994 rooms
- 645 rooms
- 96 rooms
- 77 rooms
- 78 rooms
- 109+ rooms


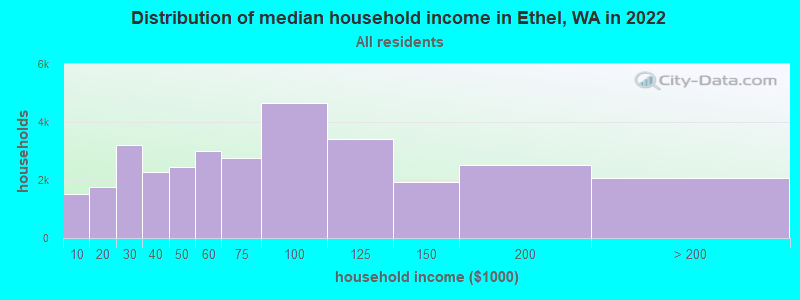
Ethel, WA household income distribution

- 1,529Less than $10,000
- 1,757$10,000 to $19,999
- 3,202$20,000 to $29,999
- 2,283$30,000 to $39,999
- 2,445$40,000 to $49,999
- 3,003$50,000 to $59,999
- 2,774$60,000 to $74,999
- 4,643$75,000 to $99,999
- 3,428$100,000 to $124,999
- 1,934$125,000 to $149,999
- 2,526$150,000 to $199,999
- 2,074$200,000 or more
Percentage of workers working in this county: 75.6%
Number of people working at home: 187 (15.8% of all workers)
Travel time to work (commute)
- Less than 5 minutes: 32
- 5 to 9 minutes: 73
- 10 to 14 minutes: 64
- 15 to 19 minutes: 141
- 20 to 24 minutes: 213
- 25 to 29 minutes: 69
- 30 to 34 minutes: 111
- 35 to 39 minutes: 17
- 40 to 44 minutes: 30
- 45 to 59 minutes: 26
- 60 to 89 minutes: 62
- 90 or more minutes: 30
Means of transportation to work:
- Drove a car alone: 726 (74.2%)
- Carpooled: 110 (11.2%)
- Walked: 32 (3.3%)
- Worked at home: 111 (11.3%)

- Year of entry for the foreign-born population in Ethel, Washington
- 131995 to March 2000
- 131990 to 1994
- 91985 to 1989
- 01980 to 1984
- 51975 to 1979
- 41970 to 1974
- 181965 to 1969
- 23Before 1965
Most common places of birth for foreign-born residents (%):
| Ethel: | 31.8% (27) |
| Washington: | 3.4% (21,167) |
| Ethel: | 22.4% (19) |
| Washington: | 7.7% (47,568) |
| Ethel: | 16.5% (14) |
| Washington: | 0.4% (2,307) |
| Ethel: | 10.6% (9) |
| Washington: | 7.6% (46,733) |
| Ethel: | 7.1% (6) |
| Washington: | 3.3% (20,321) |
| Ethel: | 7.1% (6) |
| Washington: | 24.1% (148,115) |
| Ethel: | 4.7% (4) |
| Washington: | 6.2% (38,172) |
Place of birth for U.S.-born residents:
- This state: 1,788
- Other state: 889
- Northeast: 102
- Midwest: 260
- South: 175
- West: 352
60% of Ethel residents lived in the same house 5 years ago.
Out of people who lived in different houses, 55% lived in this county.
Out of people who lived in different counties, 63% lived in Washington.
Education attainment for males 25 years and older:
- No schooling: 3
- Nursery to 4th grade: 5
- 5th and 6th grade: 0
- 7th and 8th grade: 37
- 9th grade: 19
- 10th grade: 44
- 11th grade: 26
- 12th grade, no diploma: 32
- High school graduate (or equivalency): 322
- Less than 1 year of college: 133
- Some college more than 1 year, no degree: 161
- Associate degree: 80
- Bachelor's degree: 51
- Master's degree: 4
- Professional school degree: 0
- Doctorate degree: 0

Education attainment for females 25 years and older:
- No schooling: 7
- Nursery to 4th grade: 6
- 5th and 6th grade: 16
- 7th and 8th grade: 15
- 9th grade: 22
- 10th grade: 35
- 11th grade: 65
- 12th grade, no diploma: 37
- High school graduate (or equivalency): 344
- Less than 1 year of college: 117
- Some college more than 1 year, no degree: 146
- Associate degree: 70
- Bachelor's degree: 34
- Master's degree: 19
- Professional school degree: 7
- Doctorate degree: 0


Housing units in structures:
- One, detached: 748
- 3 or 4: 4
- Mobile homes: 377
- Boats, RVs, vans, etc.: 14
Median worth of mobile homes: $216,347
Housing units lacking complete kitchen facilities: 1.3%

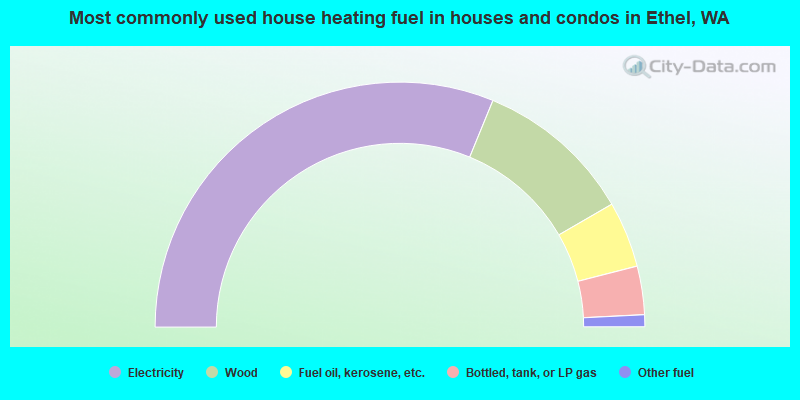
- 62.4%Electricity
- 20.9%Wood
- 8.7%Fuel oil, kerosene, etc.
- 6.4%Bottled, tank, or LP gas
- 1.6%Other fuel
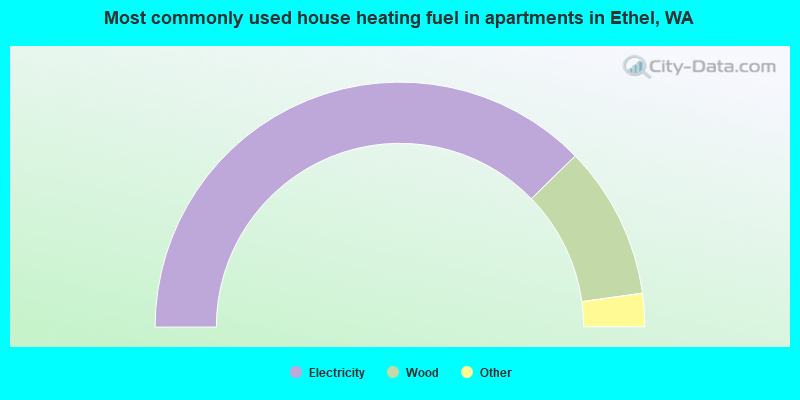
- 75.4%Electricity
- 20.2%Wood
- 2.6%Bottled, tank, or LP gas
- 1.8%Coal or coke
Private vs. public school enrollment:
| Here: | 1.1% |
| Washington: | 9.2% |
| Here: | 9.4% |
| Washington: | 7.0% |
| Here: | 5.8% |
| Washington: | 15.7% |


